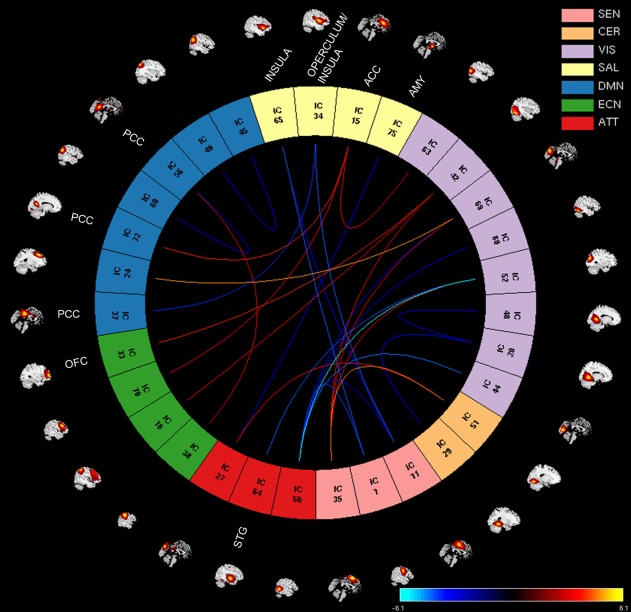
Figure 3.

Factor 1 effects showing positive and negative associations with RSNs from seven brain domains: sensorimotor (SEN), cerebellar (CER), visual (VIS), salience (SAL), default mode network (DMN), executive control (ECN), and attentional (ATT). The significant associations between FNC values and Factor 1 scores are shown with connecting curves between networks displayed as −(beta)log10(p value), color bar ranging from −6.1 to 6.1. Red and orange colors correspond to positive correlations; and dark and light blue colors correspond to negative correlations. The RSNs from the paralimbic regions listed in the plot are orbital frontal cortex (OFC, IC33), insula (ICs: 65 and 34), anterior cingulate cortex (ACC, IC15), posterior cingulate cortex (PCC, ICs: 37, 72, and 56), amygdala (AMY, IC75), and superior temporal gyrus (STG, IC64). The rest of ICs are described in Table 2 [Color figure can be viewed at http://wileyonlinelibrary.com]
