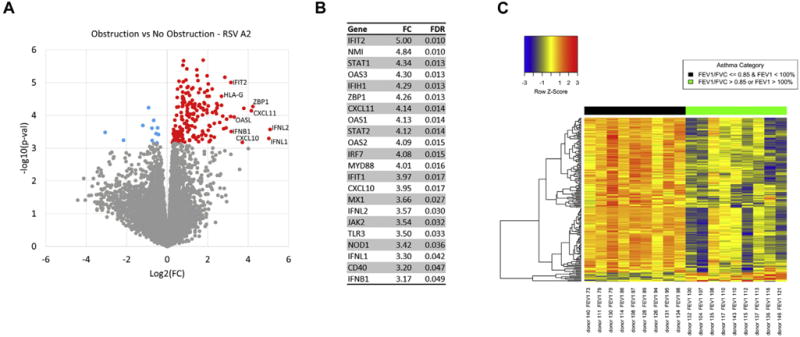
FIG 1.

Differential gene expression between children with airway obstruction and children without airway obstruction. A, A volcano plot showing group fold-change differences comparing the RSV A2-infected BECs between the group of children with obstruction and the group without obstruction. Red indicates genes with significantly higher expression in the obstruction group and blue indicates genes with significantly lower expression in the obstruction group (FDR < 0.05). B, List of differentially expressed genes including pattern recognition receptors upstream of type I interferon signaling, ISGs, type III interferons, key transcription factors downstream of type I interferon signaling, and interferon-stimulated chemoattractants regulating T cells and inflammatory leukocytes. C, A heat map of the differentially expressed genes. Gene expression levels are shown as row normalized Z scores with red reflecting higher expression and blue representing lower expression.
