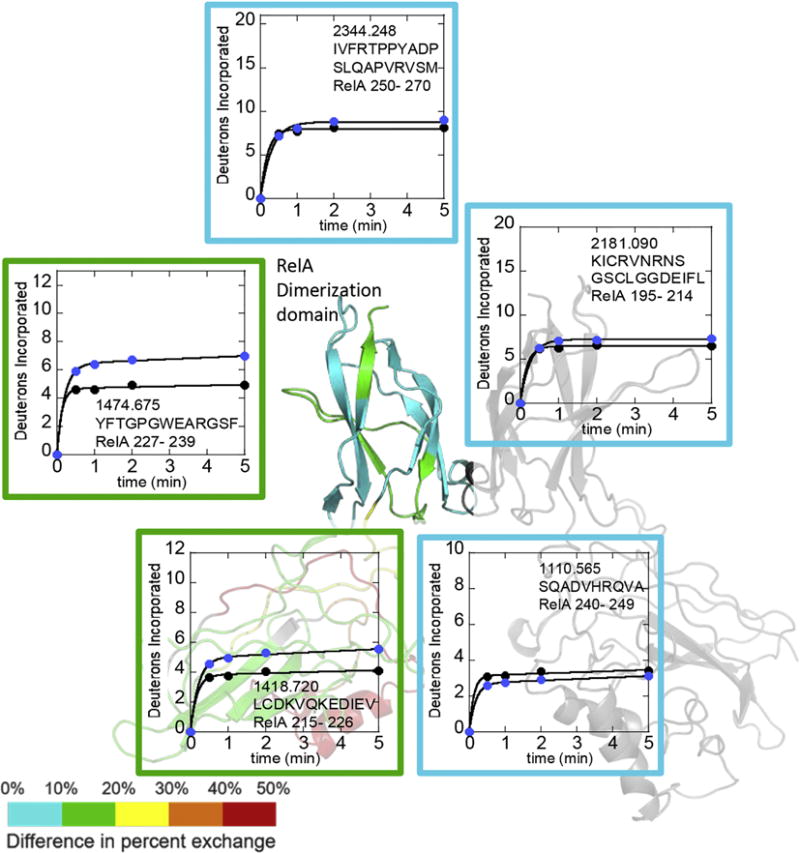
Figure 1.

Deuterium uptake plots for regions of RelA from the dimerization domain. The RelA-p50 structure (1LE9 from which DNA was removed) dimerization domain is colored on a rainbow scale representing (uptake of RelA in heterodimer – uptake of RelA in homodimer) with red being the maximum and blue being the minimum. P50 is shown in grey. Uptake of deuterium into RelA is compared for the RelA homodimer (black circles) vs RelA in the heterodimer (blue circles). The plots are boxed according to the color of the region in the structure and are placed near the structural element corresponding to the peptide.
