
Figure 2.
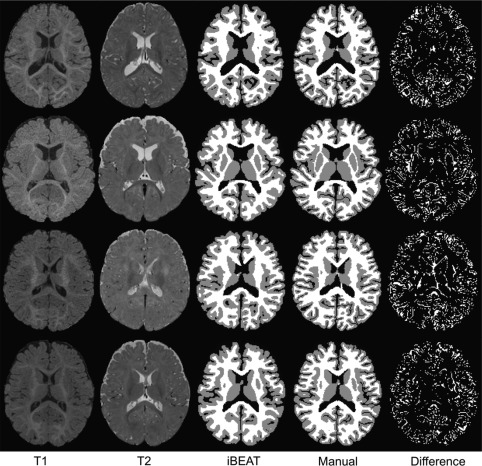
Comparison of segmentations. The 1st and 2nd columns show the original T1‐ and T2‐weighted 6‐month infant brain images, with the automatic segmentation results by iBEAT and the further manual corrections shown in the 3rd and 4th columns. The differences between iBEAT and manual correction results are also provided in the last column