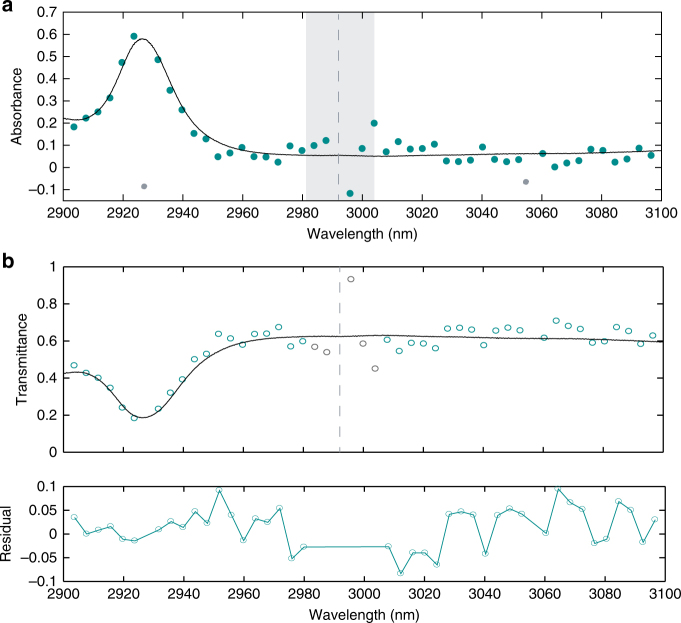
Fig. 6.
Absorption spectroscopy over a short measurement time. Two different bandpass filters are used to access the two sides of the dual-comb spectrum that are symmetric with respect to the pump wavelength of 2992 nm. The measurement time is 2 µs for each side of the dual-comb spectrum. The transmittance is calculated as the ratio between the spectrum with the cuvette and the spectrum without the cuvette. a The absorbance is the logarithm of the transmittance. The results are compared to the absorption measurement using a Michelson-based Fourier transform spectrometer equipped with a globar. The shaded region near the pump frequency (dashed line) shows large variations, which we attribute to the low SNR of the corresponding RF beat notes (<10 dB) and the imperfect spectral response of the two bandpass filters. Two points (gray) at 2927 and 3055 nm are due to missing RF beat notes shown in Fig. 5b and therefore not plotted in the transmittance curve (b). b Transmittance and its residual. The five points in gray are not used for the residual. The standard deviation of the residual is 4.1%, which is largely limited by the averaged SNR of 24 in the dual-comb spectrum

