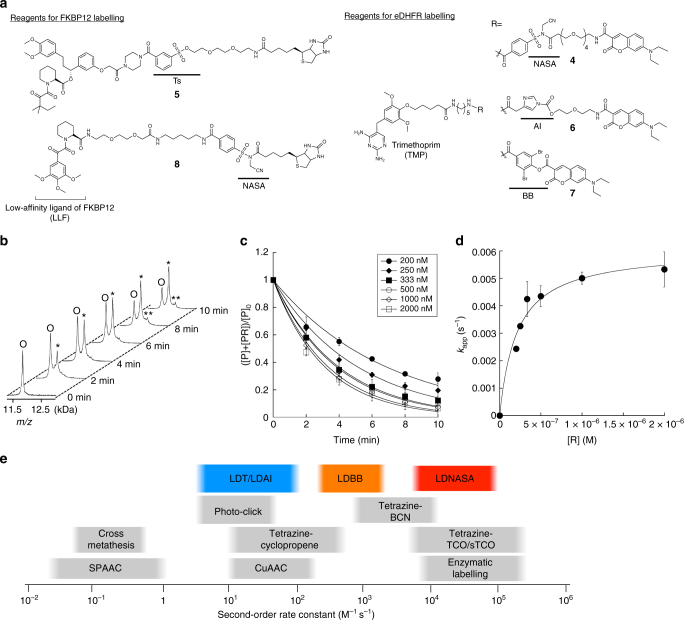
Fig. 3.
Kinetic analysis of protein labelling with various LD reagents. a Molecular structures of LD reagents. NASA, N-acyl-N-alkyl sulfonamide; Ts, tosyl; AI, alkyloxyacyl imidazole; BB, dibromophenyl benzoate. b MALDI-TOF MS analyses of labelling process of FKBP12 with 1. Purified FKBP12 (100 nM) was incubated with 1 (200 nM) in HEPES buffer (50 mM, pH 7.2) at 37 °C. O, native FKBP12 (Mw: 11 914); *, single-labelled FKBP12 (Mw: 12 140); **, double-labelled FKBP12 (Mw: 12 366). c Time course of the depletion of native (non-labelled) FKBP12 during the labelling reaction with various concentrations of 1. Purified FKBP12 (100 nM) was incubated with reagents (200–2000 nM) in HEPES buffer (50 mM, pH 7.2) at 37 °C. The reaction was monitored by MALDI-TOF MS. The pseudo-first order reaction rates (kapp) were obtained by fitting the data to Eq. (2). d The dependence of kapp upon the concentration of 1. Kinetic parameters were obtained by fitting this data to Eq. (3). e Second-order rate constants of representative bioorthogonal reactions and LD chemistries for protein modification. Here, the rate constants for LD chemistries indicate the range of values when the affinity (Kd) of the ligand is 10−7–10−6 M. The rate constants for the bioorthogonal reactions were obtained from refs 5,10. Error bars represent s.d., n = 3

