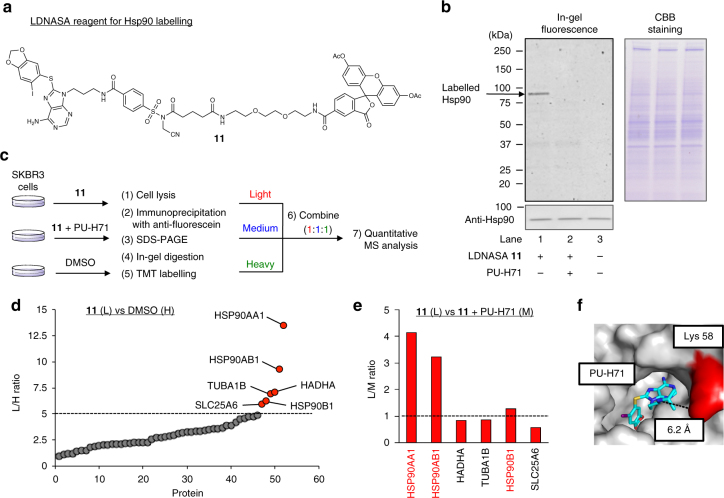
Fig. 5.
Selective and site-specific labelling of endogenous Hsp90 in live cells. a Molecular structure of LDNASA 11 for Hsp90 labelling. b SDS-PAGE and western blotting analysis of the labelling reaction in live SKBR3 cells. The cells were treated with 11 (0.5 µM) in the absence or presence of PU-H71 (10 µM) for 3 h at 37 °C in medium (pH 7.4). After washing, the cells were lysed and analysed by in-gel fluorescence and western blotting using anti-Hsp90 antibody. c Workflow for TMT-based quantitative LC-MSMS analysis of proteins labelled with 11. After in-gel digestion, obtained peptide fragments were modified with Light- (L-), Medium- (M-), or Heavy- (H-) TMT reagent for samples treated with 11 (0.5 µM, 3 h), 11 with PU-H71 (10 µM), or DMSO, respectively. d L/H ratio plots for total proteins identified in experiments comparing cells treated with 11 versus DMSO. Proteins with median L/H ratios >5 are assigned as 11-labelled proteins (red plots). e L/M ratios (11 versus 11 with PU-H71) of proteins assigned as 11-targets. Gene names of ligand-specific targets (L/M ratios >1) and off-targets (L/M ratios <1) are written in red and black, respectively. f The crystal structure of the N-terminal ATP binding domain of Hsp90α–PU-H71 complex (PDB ID: 2FWZ). The residue (Lys 58) modified with 11 and 12 is highlighted in red, and the PU-H71 ligand is coloured in blue

