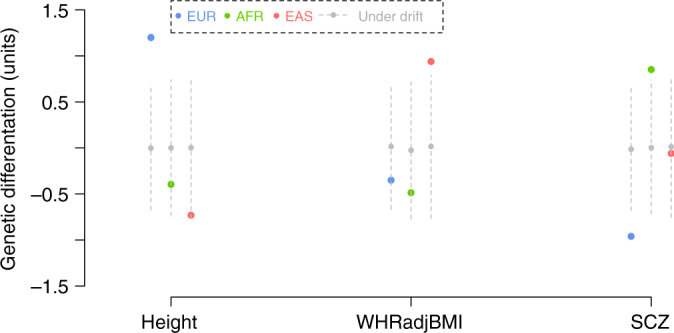
Fig. 2.

Direction of genetic differentiation for height, WHRadjBMI and SCZ in the 1000G populations. The colored dot represents the estimated deviation (in s.d. units) of the mean PRS based on the trait-associated SNPs clumped at of a population from the overall mean across populations. The gray dot represents the mean of mean PRS values of 10,000 sets of control SNPs, with the gray dashed line indicating the 95% confidence interval of the distribution of mean PRS values. WHRadjBMI, waist-to-hip ratio adjusted by BMI; SCZ schizophrenia, EUR European, AFR African, EAS East Asian
