Fig. 3.
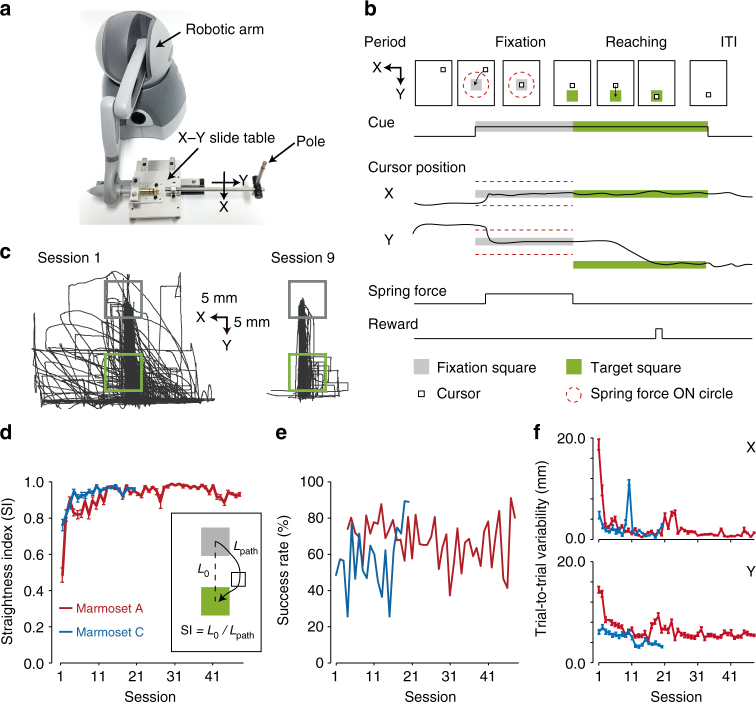
Learning of the one-target reaching task. a An X–Y slide table to enable marmosets to control the pole on a 2D working space (53 mm for the X-axis and 90 mm for the Y-axis). A robotic arm was connected to the table. b The task consisted of fixation and reaching periods, and an inter-trial interval (ITI). During the reaching period, a target (green) was presented and marmosets used the manipulandum to move the cursor from a fixation square (gray) to the target and hold it for 10–300 ms to obtain a reward. c Reaching trajectories in sessions 1 and 9 in marmoset A. Each trajectory for each trial is overlaid. Gray and green boxes indicate the fixation and target squares, respectively. d Time course of the mean straightness index (SI) of the successful reaching trajectory in marmosets A (red) and C (blue). CCs between SI and the training session were 0.48 (0.45 without the initial session) for marmoset A (P < 0.01) and 0.70 (0.65 without the initial session) for marmoset C (P < 0.01). e Time course of the success rate. The success rate was calculated by dividing the number of rewarded trials by that of all trials. The success rate in marmoset C was relatively low until session 15, because marmoset C had difficulties in stopping and holding the cursor within the target square, and the cursor frequently passed through it, even though the trajectory became straighter. f Time course of the trial-to-trial variability (see Methods) of X (top) and Y (bottom) coordinates for the successful reaching trajectories in marmosets A (red) and C (blue). The CCs between mean of the root mean square deviations (RMSDs) of X and Y coordinates and the session number in marmoset A were −0.58 (–0.55 without the initial session) and −0.55 (–0.52 without the initial session), respectively, P < 0.01, while for marmoset C they were −0.44, P = 0.054 (–0.36 without the initial session, P = 0.12), for the X coordinate, and −0.85 (–0.83 without the initial session), P < 0.01, for the Y coordinate

