Fig. 4.

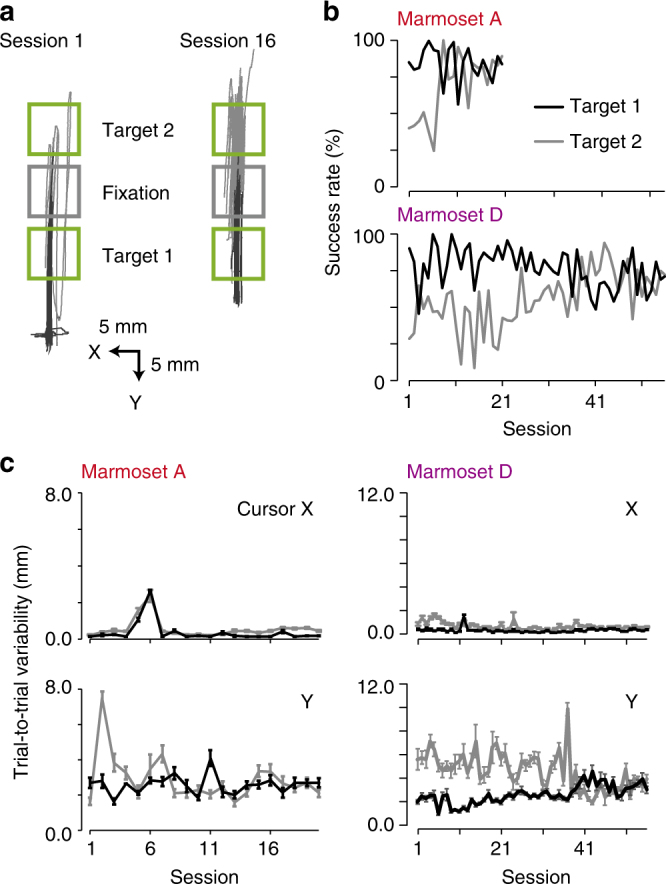
Learning of the two-target reaching task. a Reaching trajectories in sessions 1 and 16 of the two-target reaching task in marmoset A. Black and gray solid lines represent reaching trajectories for the targets below (target 1) and above (target 2) the fixation square, respectively. Other conventions are the same as in Fig. 3c. b Time course of the success rates for different targets in marmosets A (top) and D (bottom). CCs between the success rate for target 1 and session number were −0.23 for marmoset A, P = 0.32, and −0.44 for marmoset D, P < 0.01. CCs between the success rate for target 2 and session number were 0.68 for marmoset A, P < 0.01, and 0.61 for marmoset D, P < 0.01. c Time course of the trial-to-trial variability of the successful reaching trajectory to targets 1 (black) and 2 (gray) in marmosets A (left) and D (right). For marmoset A, CCs between the variability of the reaching target 1 and session number were −0.05 and 0.01, P = 0.84 and P = 0.97, for X and Y coordinates, respectively. CCs for the variability of reaching target 2 were 0.25 and −0.18, P = 0.27 and P = 0.44, for X and Y coordinates, respectively. For marmoset D, CCs for the variability of reaching target 1 were 0.08 and 0.72, P = 0.54 and P < 0.01, for X and Y coordinates, respectively. CCs for the variability of reaching target 2 were −0.39 and −0.64, P < 0.01 and P < 0.01, for X and Y coordinates, respectively. Marmoset D demonstrated a slow learning rate for reaching target 2, with the variability for reaching target 1 increasing. This might be because marmoset D had performed the one-reaching task with a force field for approximately 30 days, and had become heavily habituated to reaching target 1
