Fig. 7.
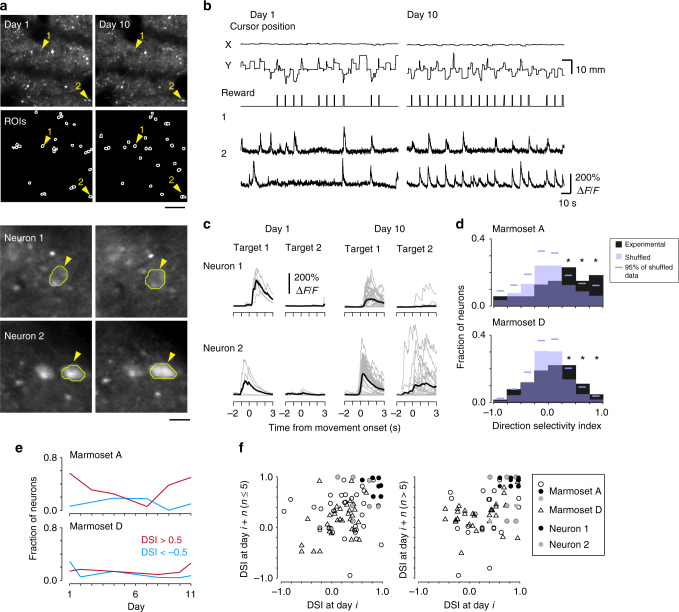
In vivo two-photon multi-day imaging in the motor cortex during the reaching task. a Time-averaged two-photon images of GCaMP6f from marmoset A on imaging days 1 and 10 (first row), and ROIs identified by the CNMF algorithm (second row). Magnified areas around neurons 1 (third row) and 2 (fourth row), and their contours, are also shown. Scale bars: 100 μm for the whole images and 15 μm for the magnified images. b X and Y positions of the cursor, reward timing, and the traces of motion-corrected raw fluorescence signals in two representative neurons from imaging days 1 and 10 shown in a. c Traces of denoised ΔF/F signals of neurons 1 and 2 aligned to the cursor movement onset. Gray and black traces represent individual trials and the average, respectively. d Histogram of DSI of neurons pooled from six imaging sessions (black boxes). Purple boxes and lines indicate the distributions of shuffling-averaged DSI from the trial shuffled data, and the 95th percentile of 1000-time shuffling in individual bins, respectively. For both marmosets, fractions in the three bins with >0.25 DSI were above the 95th values (*P < 0.05). e Fractions of neurons with DSI >0.5 (red) and <−0.5 (cyan) in each session. CCs between the fraction of the neurons with DSI >0.5 and the imaging day, −0.09 and −0.03, P = 0.91 and P = 1.0, in marmosets A and D, respectively; neurons with DSI <−0.5, −0.14 and −0.54, P = 0.80 and P = 0.29, in marmosets A and D, respectively. f Similarity in the DSI of the same task-relevant neurons between different imaging days. Each point represents the DSIs of the same neuron on an imaging day and a following day ≤5 days apart (left) or >5 days apart (right). The CCs for the DSIs with session intervals ≤5 days were 0.23 and 0.45 (n = 50 and 31, P < 0.05 for both cases) for marmosets A and D, respectively, while those for an interval >5 days were 0.45 and 0.30 (n = 33 and 35, P < 0.01 and P < 0.05), respectively

