Fig. 8.
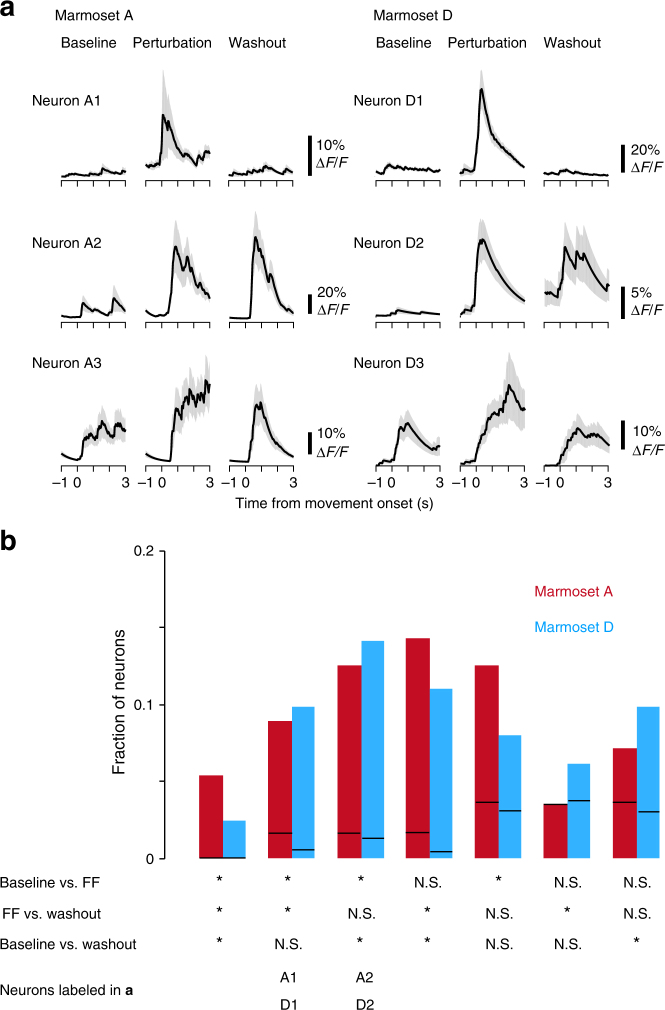
Changes in neuronal activity during the force-field adaptation task. a The task-relevant activity of six representative neurons (three from marmoset A and three from marmoset D). Denoised ΔF/F traces were aligned to the cursor movement onset. Lines and shaded areas represent mean ± SEM (n = 12–20 successful trials occurring during imaging for each block). Neurons A3 and D3 did not show significant differences in activity between the three blocks (Kruskal-Wallis test, P = 0.53 and 0.14, respectively). b Fractions of seven groups of neurons that showed significantly different activity between the three blocks (Kruskal-Wallis test, P < 0.05) with respect to the task-relevant neurons for each marmoset. According to the significance in the post-hoc test (P < 1−[1–0.05]1/3), these neurons were classified into seven groups. Red, marmoset A. Cyan, marmoset D. Asterisk indicates a statistical difference between the pair of blocks shown on the left. N.S. indicates a non-statistical difference. The bottom indicates which groups of neurons (A1, A2, D1, and D2) in a were assigned to. Black line in each fraction box indicates the 95th percentile of the fraction obtained from trial shuffled data. Fractions, except for that in the second row from the right in marmoset A, were larger than the corresponding 95th percentiles

