Fig. 9.
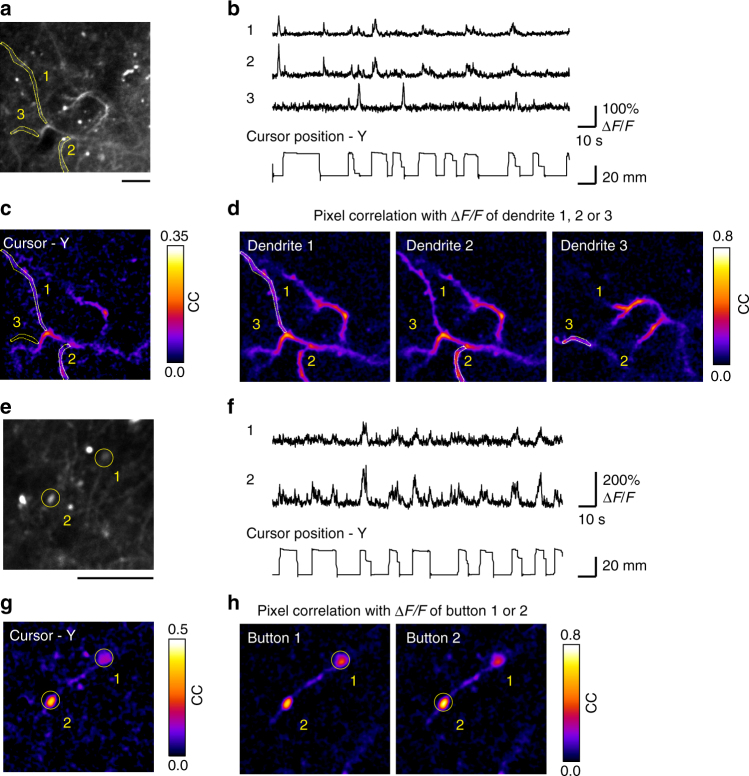
Two-photon imaging of subcellular activity in layer 1 of the M1 during the task. a Representative time-averaged two-photon image of dendritic compartments at a depth of 51 μm from the cortical surface in the M1 of marmoset D. Scale bar, 30 μm. b Motion-corrected ΔF/F traces of three representative dendritic compartments indicated by the numbers in a. The Y-axis trajectory of the pole is shown at the bottom. c Map of correlation coefficients between the Y-axis cursor trajectory and the ΔF/F trace in each pixel. d Map of correlation coefficients in the ΔF/F traces with ROI 1 (left), ROI 2 (middle), and ROI 3 (right). e Representative time-averaged two-photon image of axonal buttons at a depth of 46 μm in the M1 of marmoset D. Scale bar, 20 μm. Other conventions are the same as in a. f Motion-corrected ΔF/F traces of two representative axonal buttons indicated by the numbers in e. g Map of correlation coefficients between the Y-axis cursor trajectory and the ΔF/F trace in each pixel. h Maps of correlation coefficients for the fluorescence changes for ROI 1 (left), and ROI 2 (right)

