Figure 2.
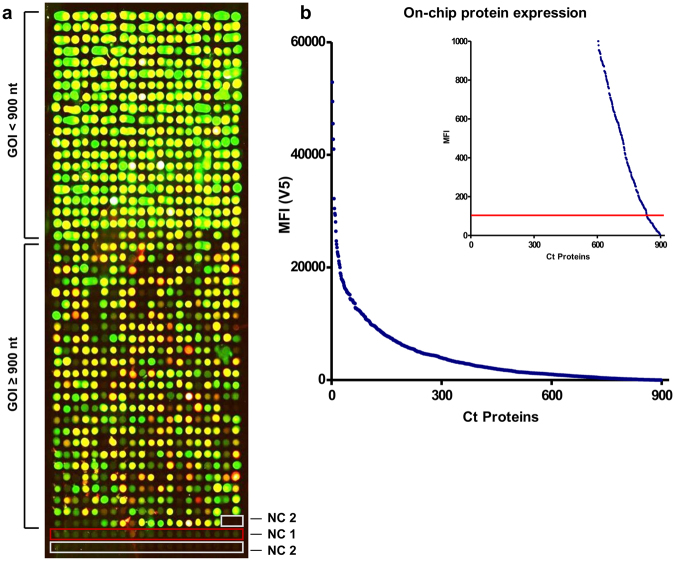
Microarray displaying the whole-proteome of Ct. (a) Results of the determination of on-chip protein expression using antibody staining against the terminal tags (green signal: anti-V5 antibody; red signal: anti-His antibody; yellow signal: overlay of both signals). All 898 proteins were spotted onto one array. The last 22 spots indicated by red and white frames represent the negative controls NC1 and NC2, respectively. The upper part of the array comprised genes of interest (GOI) with a DNA template length of up to 900 bp. (b) Final MFI values obtained by the anti-V5 antibody were sorted in descending order and plotted against the overall number of Ct proteins. The calculated cut-off (100 MFI) is represented by a red line, indicating that less than 10% of all proteins are below the cut-off and are therefore considered not to be expressed in full length.

