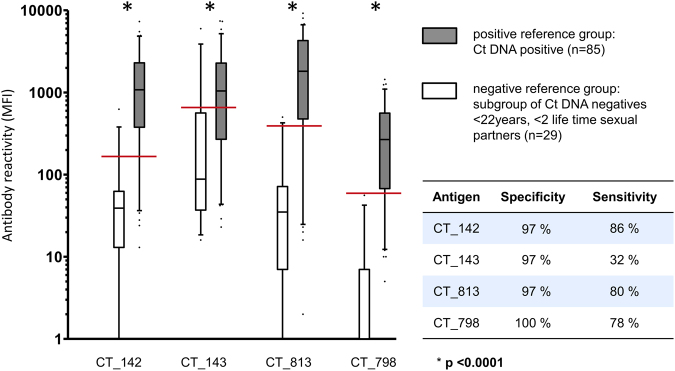
Figure 6.
Performance of de novo identified antigens in multiplex serology. Two Ct infection reference groups (grey, positive, and white, negative) were analyzed with four antigens representing possible new serological Ct infection markers. On the y-axis, MFI are plotted on a logarithmic scale, and distribution of reactivities for each group and antigen is displayed as box plot. Cut-off values were determined by Receiver Operating Characteristic (ROC) analysis and are shown as red lines resulting in specificity and sensitivity estimates shown in the inserted table.

