Figure 1.
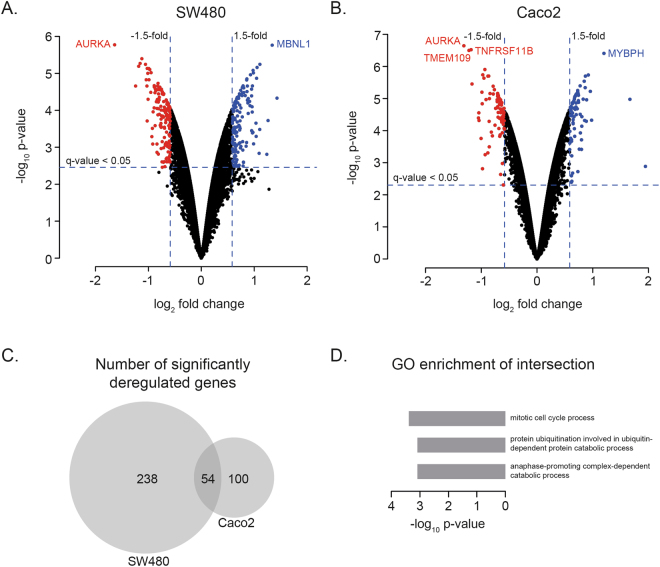
Differential mRNA expression analysis of AURKA knockdown in SW480 (A) and Caco2 (B) colorectal cancer cell lines. (A) and (B) Volcano plot of all unique genes from the differential mRNA expression analysis upon AURKA downmodulation for the SW480 and Caco2 cell lines, respectively. The vertical and horizontal lines illustrate the boundaries between significantly downregulated genes (red dots), significantly upregulated genes (blue dots) and non-significant differential genes (black dots). Horizontal lines represent the significance threshold of the q-value < 0.05. Vertical lines represent the significance threshold of the fold change 1.5 (log2 fold change 0.58) up or down. C) VENN diagram of the number of significantly deregulated genes in SW480 and Caco2 (see Table 1). D) GO enrichment of the genes (n = 53) that are significantly deregulated in both cell lines in the same direction (the intersection in the Venn diagram in C minus one gene).

