Figure 4.

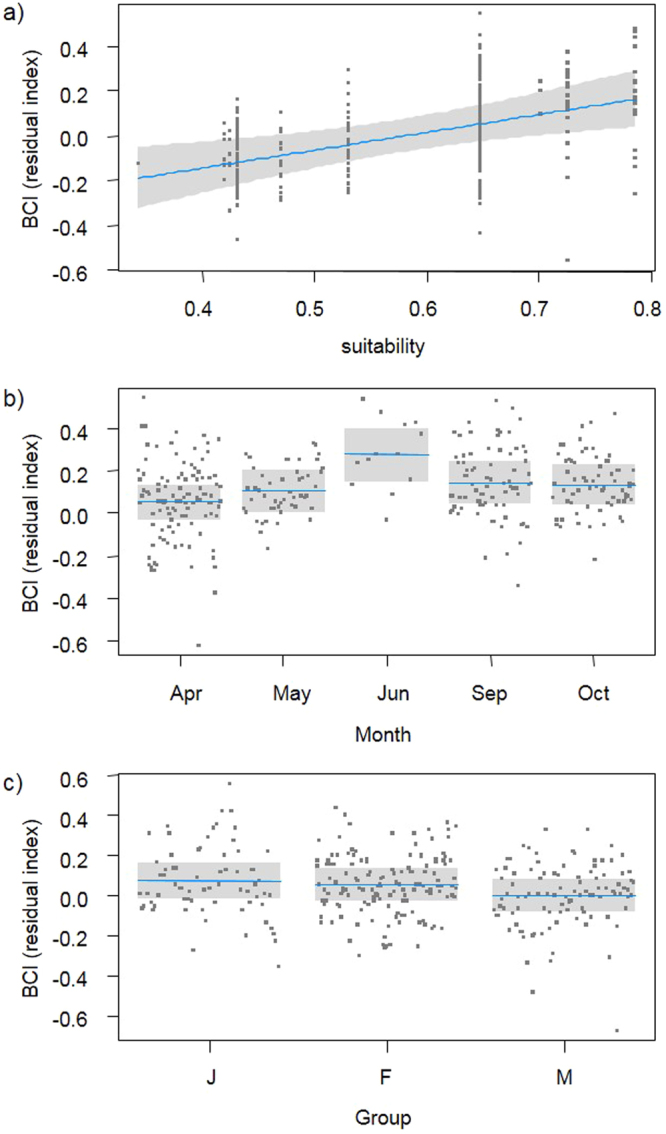
Partial regression plots of relationships between body condition index (BCI) and (a) environmental suitability; (b) month of survey; (c) age class and sex. Horizontal line represents mean values, while shaded box are 95% CI.

Partial regression plots of relationships between body condition index (BCI) and (a) environmental suitability; (b) month of survey; (c) age class and sex. Horizontal line represents mean values, while shaded box are 95% CI.