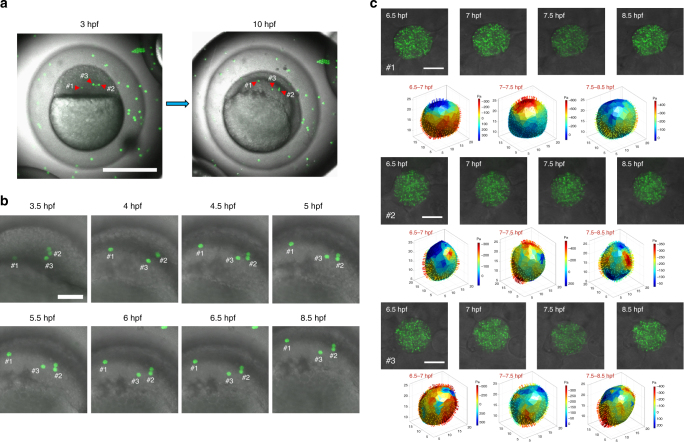
Fig. 10.
Substantial spatial and temporal traction variations inside a zebrafish. a A developing zebrafish embryo from 3 to 10 hpf with numerous embedded microgels, of which #1, #2, and #3 microgels are imaged and their tractions are calculated. Scale bar, 500 μm. b Corresponding high magnification confocal sections of the three embedded microgels at different stages of development at distinct locations. A microgel near #2 microgel is too blurry such that its tractions could not be quantified. Scale bar, 100 μm. c 3D plots of relative total tractions (changes in total tractions) for the corresponding microgels from 6.5 to 7, 7 to 7.5, and 7.5 to 8.5 hpf. For clarity, only total tractions are shown here. All scale bars, 10 μm

