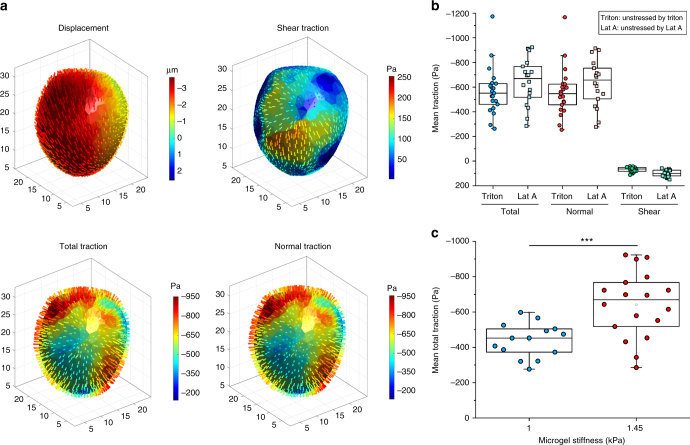
Fig. 5.
Quantification of tractions generated by multilayered cells. a An example of deformation and tractions on the elastic round microgel (ERMG) exerted by the multilayered cells. b Summarized data of total, normal, and shear tractions applied onto the ERMGs (Young’s modulus of 1.45 kPa). n = 21 ERMGs for Triton-treated cells and n = 18 ERMGs for Lat A-treated cells. c Scatter plot of mean total traction with respect to Young’s modulus of the microgels. The tractions were calculated using 1 µM Latrunculin A-treated samples as the unstressed reference condition. Solid lines in the box plots correspond to 25th percentile, median, and 75th percentile; n = 14 for 1 kPa; n = 18 for 1.45 kPa. ***P < 0.001. One-tailed Student’s t-test was used

