Fig. 7.
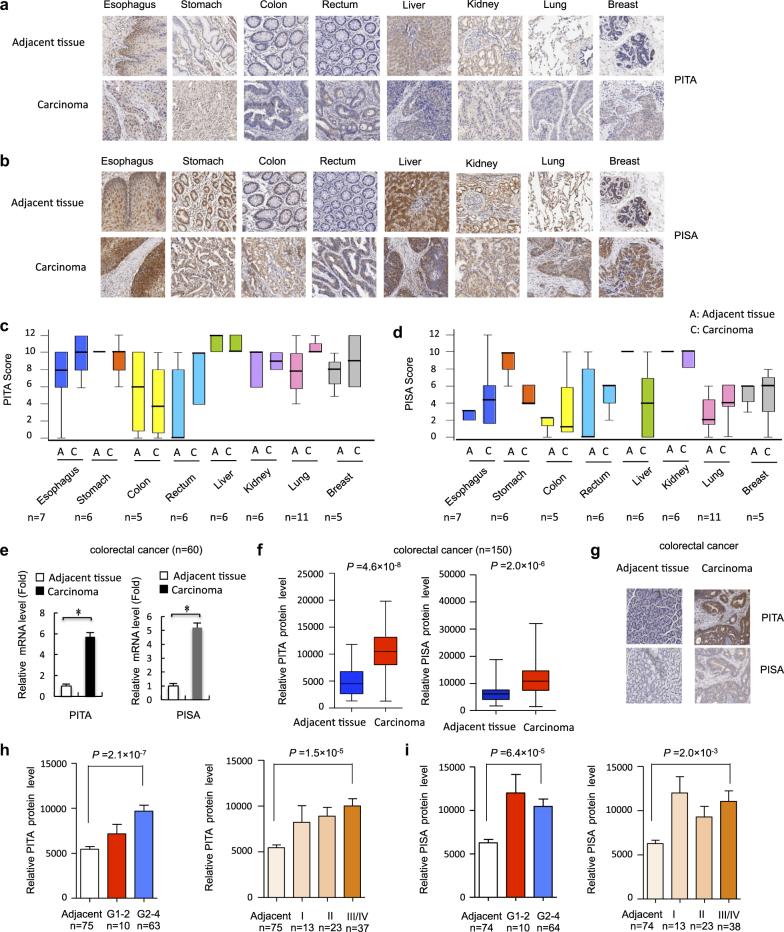
The expression of PITA and PISA is elevated in human tumor tissues. a, b Images of immunohistochemical staining for PITA and PISA in 8 types of paired cancers and normal tissues. Scale bar, 50 µm. c, d Box plot of PITA and PISA expression in 8 types of cancers and normal tissues. e Quantitative RT-PCR analysis of PITA and PISA mRNA level in rectal cancer tissue and matched adjacent normal control from 60 subjects. Error bars represent mean ± s.d. for three independent experiments. Error bars represent mean ± SD for three independent experiments. *P < 0.05: two-tailed unpaired t-test. f PITA and PISA protein levels in colorectal cancer tissue (n = 150). The positively stained nuclei (%) in grouped samples were analyzed by two-tailed unpaired t-test. g Representative images of immunohistochemical staining for PITA and PISA are shown. Scale bar, 50 µm. h, i The positively stained nuclei (%) in grouped samples were analyzed by two-tailed unpaired t-test. (histological grades I, II, III, and IV or tumor stages I–IV). The positively stained nuclei (%) in grouped samples were analyzed by two-tailed unpaired t-test

