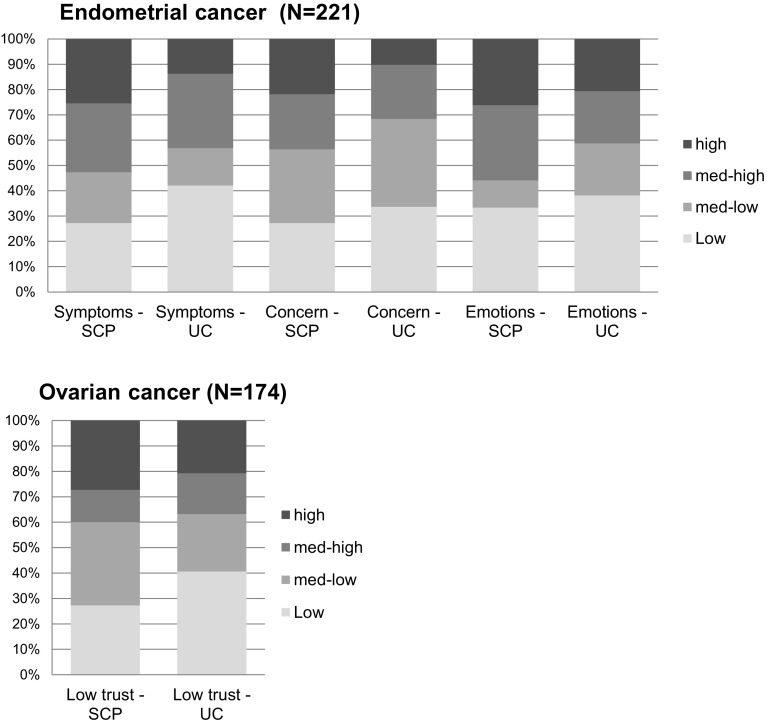
Fig. 1.
Bar charts of illness perceptions after diagnosis, SCP care (SCP) versus usual care (UC). Note only the illness perception items were included that have earlier been associated with trial allocation. High, med-high, med-low, and low illness perception categories were defined by the 25th, 50th, 75th, and 100th percentile scores of each B-IPQ scale separately

