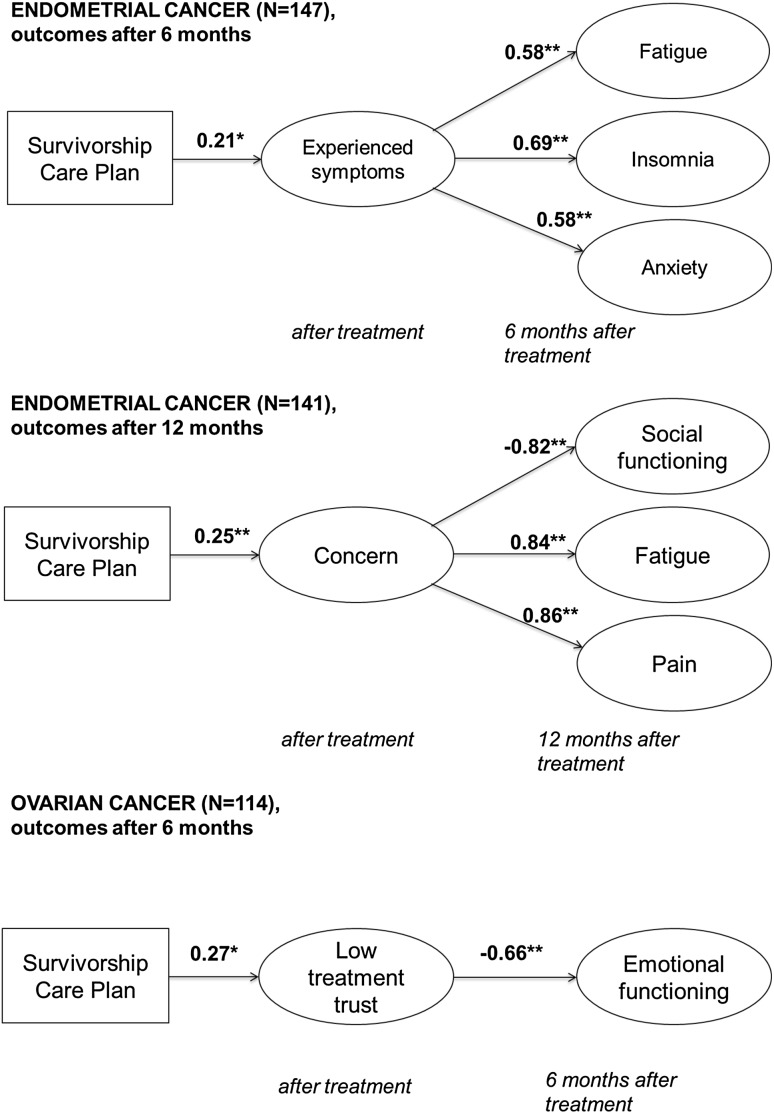
Fig. 2.
Path diagrams of the final structural equation models, outcomes 6 and 12 months after treatment. Note only the significant paths between the intervention (SCP), illness perception items, and outcome scales were entered in this model to obtain good model fit. Standardized coefficients are shown. Standardized beta coefficients were used to interpret the models, and range from − 1 to 1, in which coefficients closer to zero indicate smaller effects. Error terms and covariates in the model (age, FIGO stage, number of comorbidities) have been removed from the figure. *p < 0.05; **p < 0.01

