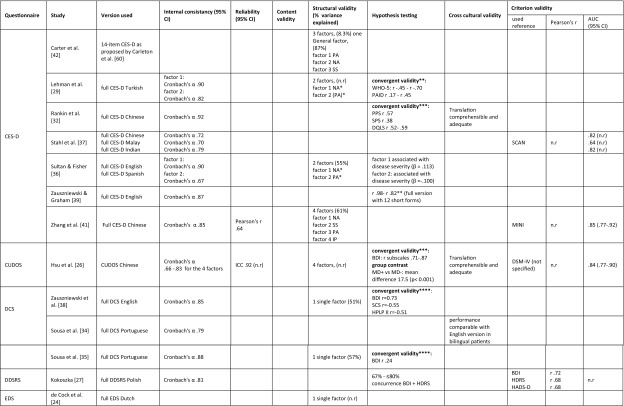
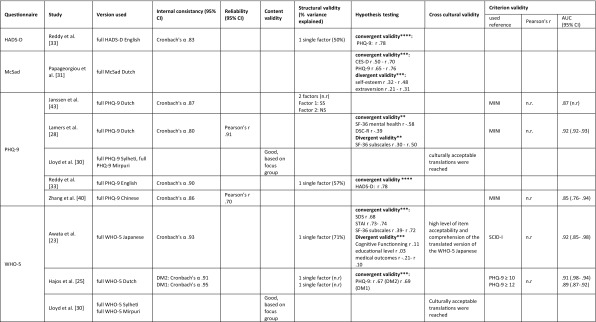
Table 5.
Results of all assessments of measurement properties, organized by questionnaire
95% CI 95% confidence interval, AUC area under the curve, BDI Beck Depression Inventory, CES-D Centre for Epidemiological Studies Depression Scale, cog. cognitive, CSDD Scale for the Diagnosis of Depression, CUDOS Clinically Useful Depression Outcome Scale, DCS Depression Cognition Scale, DDSRS Depression in Diabetes Self-Rating Scale, DM1 diabetes mellitus type 1, DM2 diabetes mellitus type 2, DQLS Diabetes Quality of life Scale, DSC-R diabetes symptom checklist-revised, DSM-IV diagnostic and statistical manual of mental disorders, fourth edition, EDS Edinburgh Depression Scale, HDRS Hamilton Depression Rating Scale, HADS-D Hospital Anxiety and Depression Scale-Depression, HPLP-2 health promoting lifestyle profile-II, ICC intra class correlation, IP interpersonal problems, n.r. not reported, MD major depression, MINI Mini International Neuropsychiatric Interview, MSA Mokken Scale Analysis, NA negative affect, n.r. not reported, NS non-somatic symptoms, PA positive affect, PAID problem areas in diabetes, PCA principal component analysis, PHQ-9 Patient Health Questionnaire, PPS Pscychological Problems Scale, SCAD silverstone concise assessment for Depression, SCAN schedules for clinical assessment in neuropsychiatry, SCID structured clinical interview for DSM, SCS self-control schedule, SDS Zung’s Self-Rating Depression Scale, SF-36 medical outcomes study 36-item short form health survey, SPS Social Problems Scale, SS somatic symptoms, STAI State-Trait Anxiety Inventory, WHO-5 World Health Organization-Five Well-Being Index
*Eigenvalue factor 1 (negative affect): 7.345, factor 2 (positive affect) 2.249
**Pearson’s correlation coefficient
***Spearman’s correlation coefficient
****Type of correlation coefficient not reported


