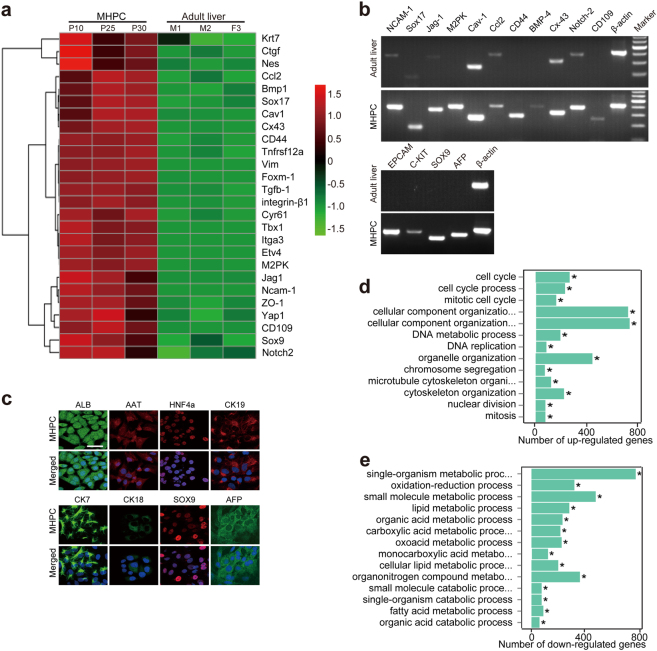
Fig. 2. Lineage specification for MHPCs.
a Hierarchial clustering analysis of global gene expression profiles to compare different passages of MHPCs with adult marmoset liver tissues. Passage 10, 25, and 30 MHPCs were used for RNA sequencing. M1 (male), M2, or F3 (female) refers to animal code. Expression levels (fold) are depicted in colors in which red represents upregulation and green means downregulation. b Semiquantitative RT-PCR analysis of hepatic progenitor cell markers for MHPCs at passage 30. Cav-1 refers to Caveolin-1; M2PK means tumor type M2 pyruvate kinase; Ccl2 chemokine (C-C motif) ligand 2; BMP4 bone morphogenetic protein 4; Cx-43 refers to Connexin 43. c Immunostaining of hepatic progenitor cell markers for MHPCs at passage 30. Nuclei was counterstained by DAPI (scale bar = 100 µm). d Gene set enrichment analysis (GSEA) of DNA replication and cell cycle-related genes for MHPCs at passage 30. DNA replication and cell cycle-related genes were significantly upregulated in MHPCs (passage 30) compared with adult marmoset liver tissues (n = 3, two-tailed t-test, *P < 0.1 × 10⁻⁴). e GSEA of cellular metabolism-related genes for MHPCs at passage 30. Cellular metabolism-related genes were significantly downregulated in MHPCs (passage 30) compared with adult marmoset liver tissues (n = 3, two-tailed t-test, *P < 0.1 × 10⁻⁴)

