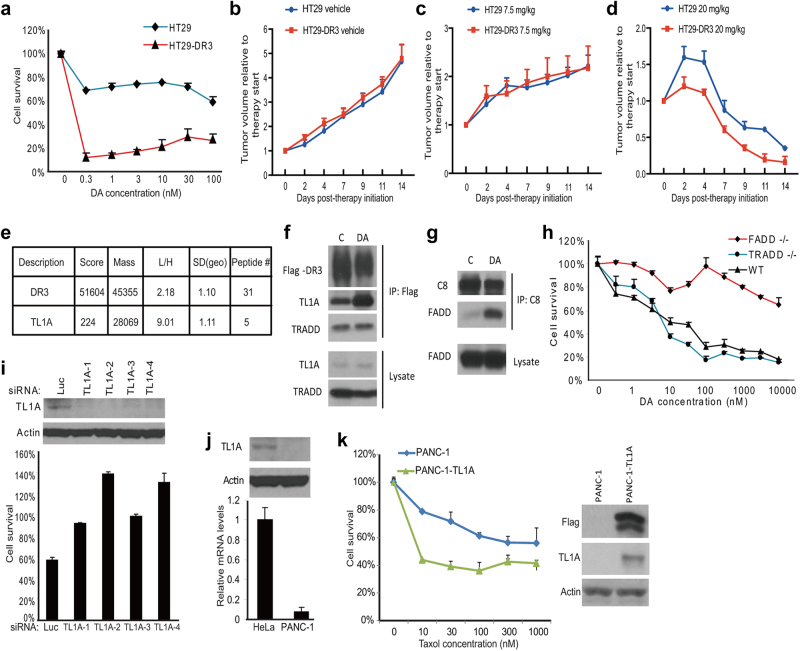
Fig. 4.
The ligand of DR3, TL1A, is required for DR3-mediated apoptosis. a The cell line stably expressing Flag-tagged DR3 was established in HT29 cells. Dose response curves of HT29 cells and HT29-DR3 cells to diazonamide were plotted. Cell viability was measured after 48 h of treatment. b–d HT29 or HT29-DR3 tumor-bearing mice were treated with vehicle (b), 7.5 mg/kg taxol (c), or 20 mg/kg taxol (d) for the indicated time. Tumor growth was monitored. Error bars, SEM. e Identification of TL1A as the only TNF family death ligand bound to DR3. A SILAC experiment was carried out to quantify the DR3 binding proteins as described in the Materials and Methods. HT29-DR3 cells growing in the light medium were treated with 100 nM diazonamide for 12 h. Untreated cells were grown in the heavy medium. Equally combined cell lysates were subjected to immunoprecipitation with an anti-Flag antibody. Proteins in the whole elution with 3× Flag peptide were quantified and the Light/Heavy ratios were calculated. SD (geo) stands for geometric s.d. The closer the SD (geo) is to 1, the better the protein quantification is. The median from peptide ratios was used as the protein ratio. (f) HT29-DR3 cells were treated with 100 nM diazonamide for 12 h. The DR3/TL1A complex was analyzed by Flag immunoprecipitation followed by western blotting with antibodies against Flag, TL1A, and TRADD. g HT29-DR3 cells were treated as in f. The DISC complex was analyzed by caspase-8 immunoprecipitation followed by western blotting with antibodies against caspase-8 and FADD. h The dose response curves of wild-type MEFs, FADD-/- MEFs, and TRADD-/- MEFs to diazonamide. i Knockdown of TL1A blocked anti-mitotics-induced apoptosis. HeLa cells were transfected with four TL1A siRNAs for three rounds before being treated with 100 nM diazonamide for 48 h. Cell viability was determined (lower panel). Protein levels of TL1A in the knockdown cells were determined by western blotting with an anti-TL1A antibody (upper panel). j, k Exogenous expression of TL1A sensitizes PANC-1 cells to taxol. j The relative TL1A mRNA levels in HeLa and PANC-1 cells were determined by qRT-PCR (lower panel). TL1A protein levels in HeLa or PANC-1 cells were determined by western blotting with anti-TL1A and anti-Actin antibodies (upper panel). k Flag-tagged TL1A was stably expressed in PANC-1 cells. Dose response curves to taxol were plotted for parental PANC-1 cells and PANC-1-TL1A cells. Cell viability was measured after 48 h treatment (left panel). Cell lysates from PANC-1 and PANC-1-TL1A cells were subjected to western blotting with anti-Flag, anti-TL1A and anti-Actin antibodies (right panel)

