Fig. 3.
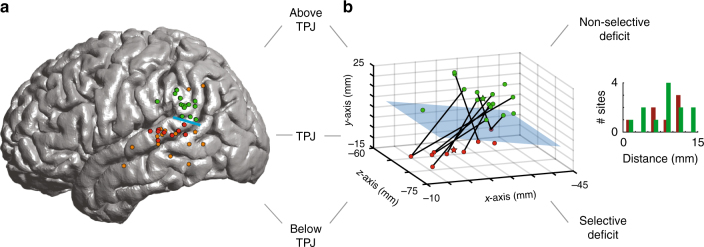
Partitioning of linguistic function within individual subjects. a Sites in which stimulation elicited a significant and selective deficit in the syntactic condition are displayed in red, whereas sites in which stimulation elicited a non-selective language deficit that involved more than one condition are displayed in green. Sites in which stimulation elicited a deficit but which did not reach the significance threshold (e.g., stimulation of the site elicited a deficit that was not reproducible on subsequent trials) are displayed in orange. b Stimulation sites are evaluated within individual subjects. Here, the anatomic locations of the stimulation sites and their relation to the TPJ plane are displayed in MNI space. The lines are used to indicate which sites were stimulated within the same subject. The bar graph in the inset represents the distance between the stimulation sites and the TPJ plane

