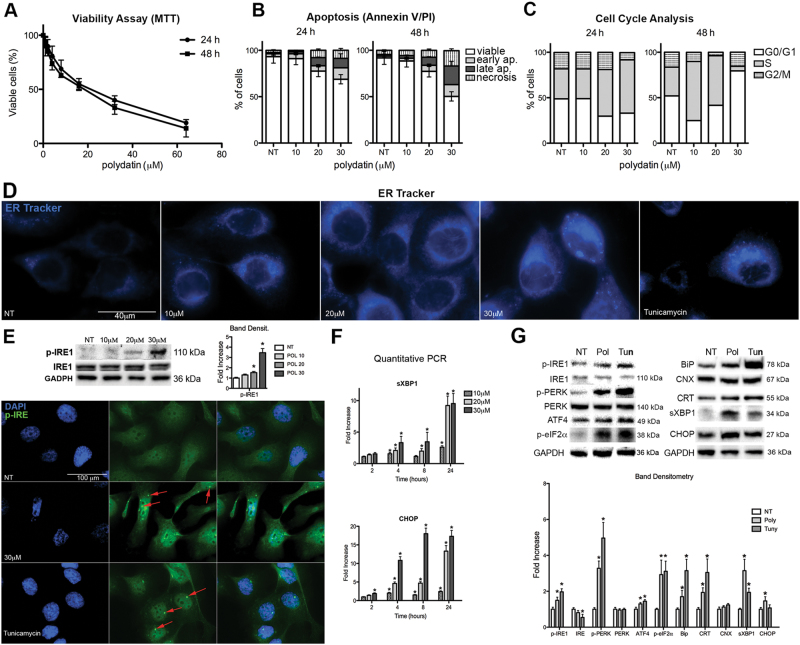
Fig. 1. Effects of polydatin treatment on UMSCC103.
a Viability assay measured by MTT (concentration range 0–70 µM) at 24 and 48 h posttreatment. b Analysis of apoptosis by Annexin V/PI assay at 24 and 48 h posttreatment (for original dot plots see Fig. S1A). c Cell cycle analysis (for original histograms and analyses see Fig. S1B). d IF with ER-Tracker 24 h posttreatment; tunicamycin is used as positive control. e Immunoblot for phospho-IRE1, 24 h posttreatment, polydatin treatments 10–30 μM. IF for phospho-IRE1, 24 h posttreatment; tunicamycin is used as positive control; red arrows represent phospho-IRE cluster. f Quantitative real time PCR for CHOP and spliced XBP1. g Immunoblot for UPR pathway and ER chaperons, 24 h posttreatment, Polydatin 20 μM. *p < 0.05. N = 3, error bar = 95% confidence

