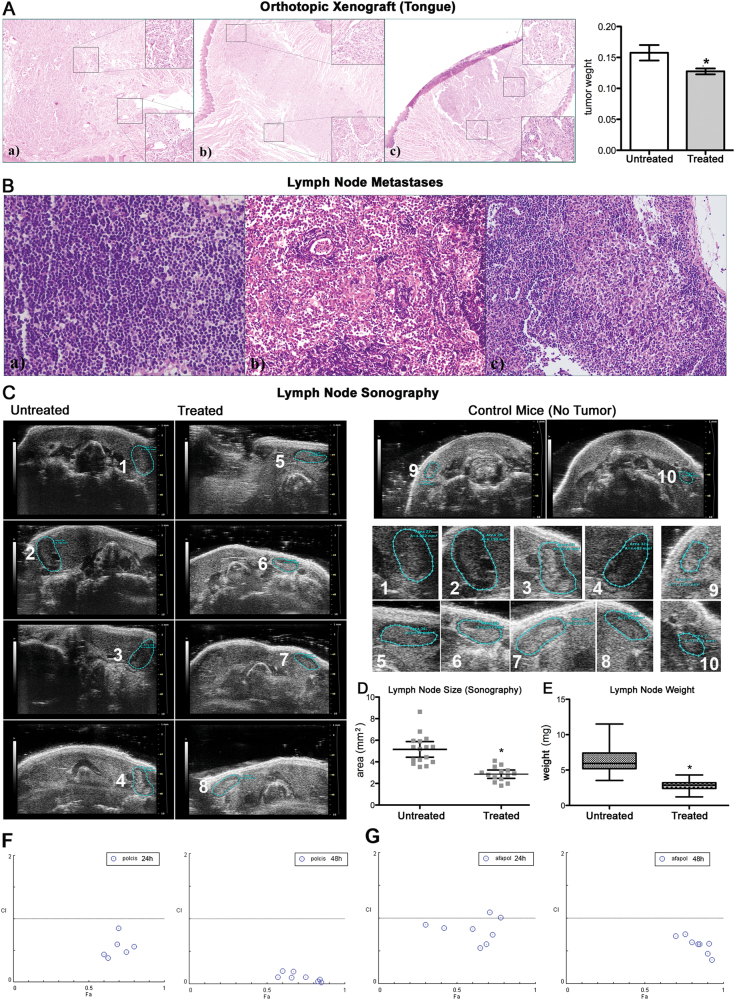
Fig. 4. Analysis of tumor growth and lymph node invasion in an orthotopic xenograft model.
a H&E staining of orthotopic xenograft in the tongue; bars, tongue weight of treated and untreated mice. b H&E staining of lymph node metastases. c Lymph node sonography and size determination on treated, untreated and control (no tumor) mice. Insets on the right, enlarged images. d Plot of lymph node size determined by sonography. e Lymph node weights of treated and untreated mice. f, g Analysis of combination index (CI) with compusin software for the combination polydatin/cisplatin and polydatin/afatinib. *p < 0.05, N = 3, error bar = 95% confidence

