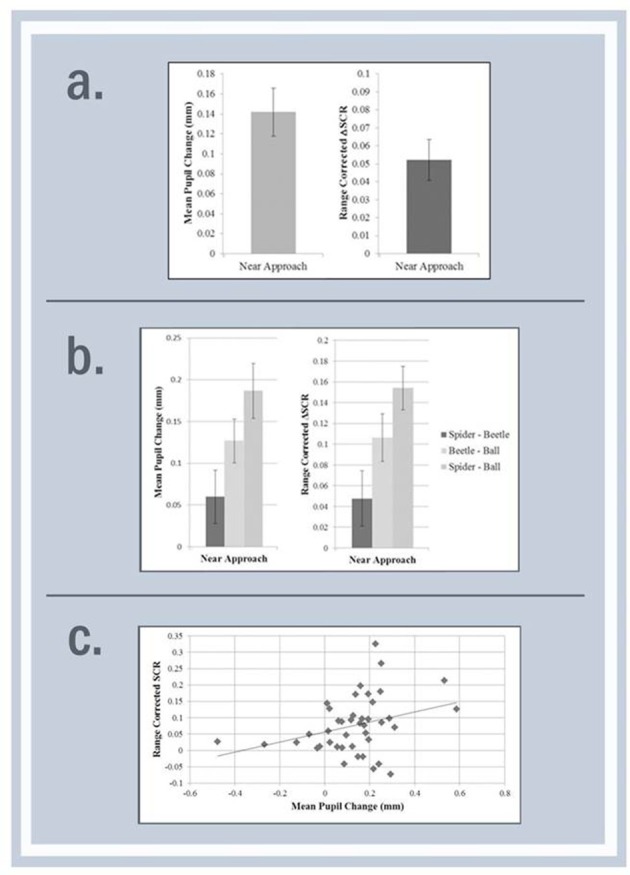
Figure 3.

Mean difference scores for the near approach comparing spider vs. ball for pupil dilation and SCR measures in Experiment 1 (a), spider vs. ball vs. beetle in experiment 2 (b), and scatterplot with the aggregated data from experiments 1 and 2 showing a significant correlation between the difference scores form the spider and ball during the near approach (c).
