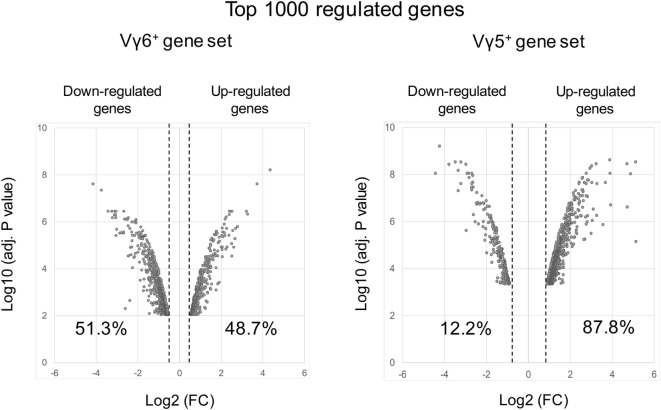
Figure 3.
Volcano plots of the top 1,000 regulated genes during Vγ6 and Vγ5 maturation. Raw data were extracted from datasets (GSE37448 and GSE15907) downloaded from the NCBI’s data repositories. Vγ6+ and Vγ5+ gene sets were generated by comparing gene expression in immature (CD24high) vs mature (CD24low) thymocytes at E17 for both populations (2–3 replicates/subset). The top 1,000 regulated genes (P < 0.05) were used to constitute the two gene sets (Table S1 in Supplementary Material). Volcano plots represent either positively or negatively regulated genes (as fold change) according to their respective P value. Labels indicate the percentage of genes that are either positively or negatively regulated in each dataset. FC, fold change.

