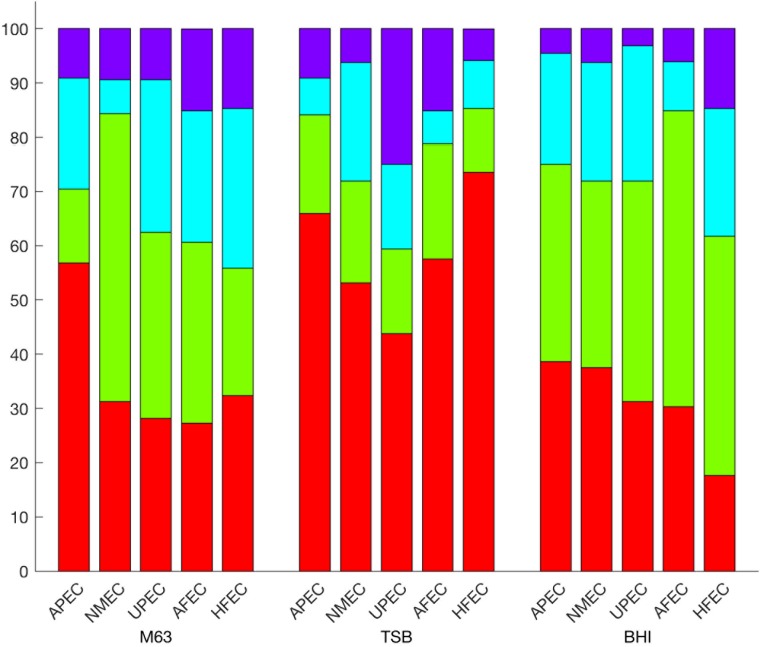
FIGURE 2.
Prevalence of biofilm formation in ExPEC subpathotypes and E. coli commensals. Percentage of negligible (red), low (green), moderate (blue), and high (purple) biofilm forming isolates by subpathotype or commensal E. coli designation. APEC and NMEC are significantly different in their abilities to form biofilms in M63 (p = 0.0064 and 0.0093, respectively).

