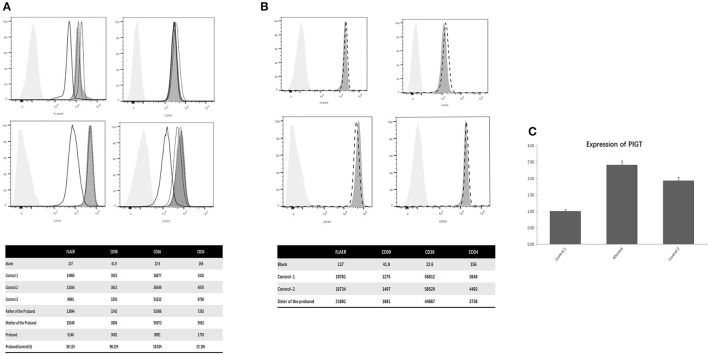
Figure 2.
(A) Flow cytometry of the proband, parents and controls; (B) Flow cytometry of the old sister of the proband and the controls; (C) PIGT mRNA expression on PBMCs. (A) The abscissa indicates the intensity of the fluorescence, the ordinate indicates the number of cells, the light gray shade represents the blank control, the dark gray shade represents the normal control, the black thick line represents the patient, the black fine line represents his mother, the black dotted curve represents his father. Shown that the expression of total GPI anchoring molecules in this patient was reduced to 39.11% of the normal controls. The expression of CD59 of the proband was similar with the normal controls. The expression of CD16 was reduced to 16.92% of the normal control and the expression of CD24 was reduced to 22.16%. Meanwhile, the abundance of the same proteins in the leucocytes of his parents was normal. (B) Shown that the level of CD16, CD24 and CD59 of the old sister (the dotted line) of the proband had no significant difference with the normal controls (The dark gray shades). (C) The level of PIGT mRNA on PBMCs of the proband was significantly higher than the two healthy controls (C).

