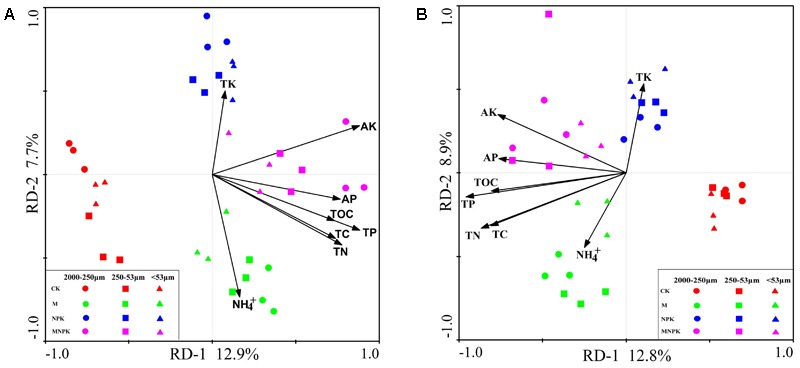
FIGURE 6.

Redundancy analyses (RDA) of the correlations between soil properties and microbial Nitrobacter (A) and Nitrospira (B) community composition. TC, total carbon; TN, total nitrogen; TP, total phosphorus; TK, total potassium; SOC, soil organic carbon; AP, available phosphorus; AK, available potassium; NH4+-N, ammonium nitrogen.
