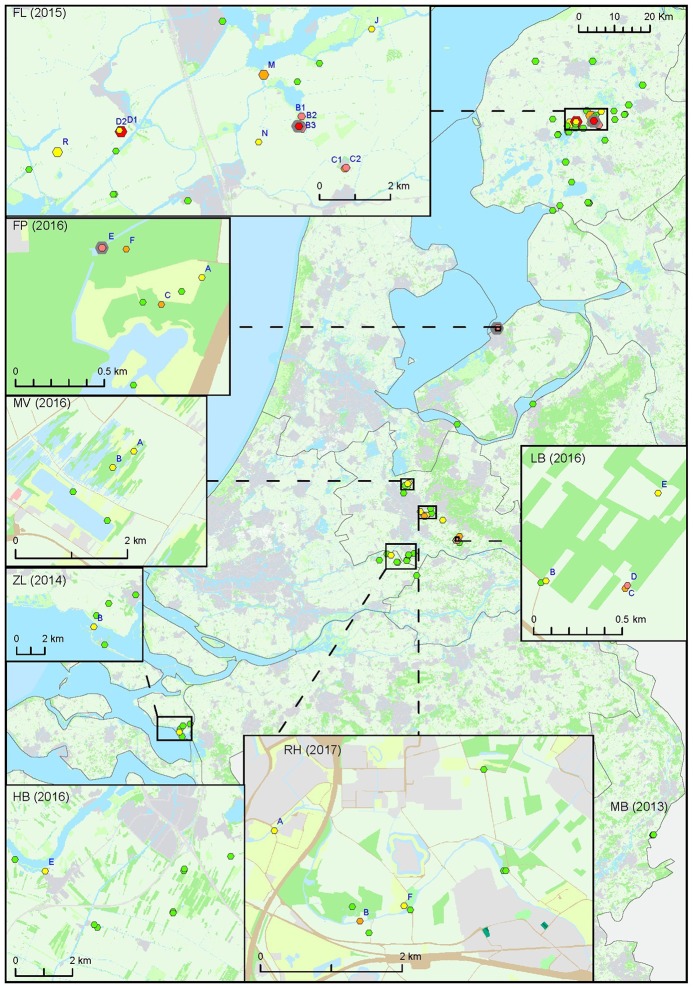
Figure 2.
Occurrence of F. tularensis in surface waters in the Netherlands following tularemia cases in humans or hares. Samples were collected between 2013 and 2017 (sample set III). Symbol sizes correlate to the number of repeated samples obtained from a particular location (range 1-8). Colors refer to the level of F. tularensis DNA in the samples and ranges from 0 (DNA not detected) to 5 (highest level). Green = 0, yellow = 1, light orange = 2, dark orange = 3, light red = 4, bright red = 5. The level was based on the detection of multicopy target ISFtu2 and singlecopy target fopA in triplicate qPCR measurements. When sampling was repeated, symbol color was based on the time-point with the highest DNA level. A pink halo indicates that F. tularensis DNA was detected at each time-point. Blue capitals cross-reference to Table 3 which gives more details on tularemia cases and water samples in which F. tularensis was detected.

