Figure 5.
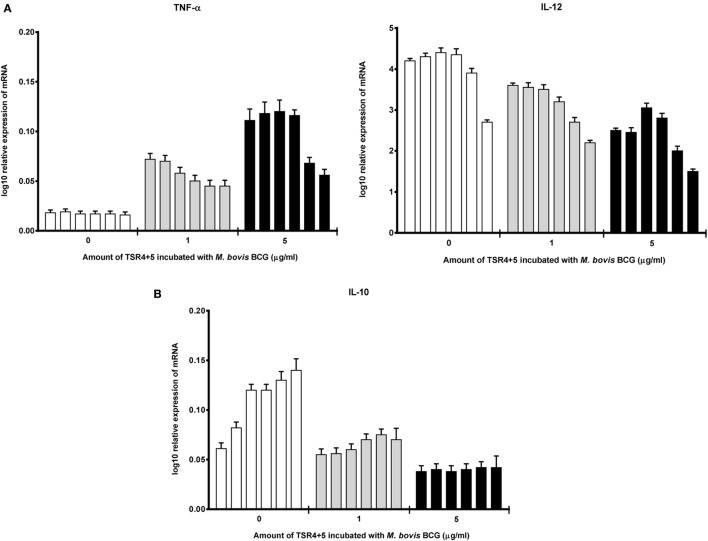
Temporal mRNA expression profile of cytokines produced by THP-1 cells incubated with different concentrations of thrombospondin repeats (TSR) 4+5 and Mycobacterium bovis BCG. (A) Pro-inflammatory cytokines: TNF-α and IL-12; (B) anti-inflammatory cytokine: IL-10. The expression of each cytokine was measured using qPCR, and the relative expression [relative quantification (RQ)] calculated by normalizing the data using human 18S rRNA expression as a control. The RQ value was calculated using the formula: RQ = 2−ΔΔCt. Assays were conducted twice in triplicates. Error bars represent SD. A two-way ANOVA test was performed on the data to determine significant differences in expression of cytokine production by TSR4+5. All comparisons were significant (p < 0.05), unless where shown (ns, not significant, p > 0.05).

