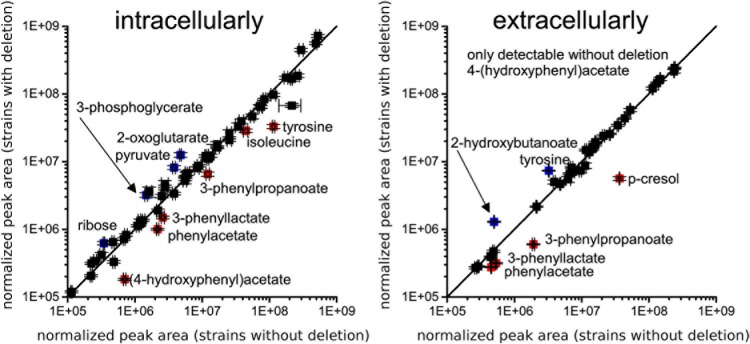
FIGURE 5.
Comparison of metabolic profiles from four isolates lacking the ABC transporter genes CDR20291_0805 and CDR20291_0806 and three wildtype isolates. Scatter plots of normalized peak areas are shown; left panel, intracellular metabolome; right panel, extracellular metabolome. Metabolites depleted or increased in deletion mutants by at least 1.5-fold with adjusted p-values < 0.01 are labeled in red and blue, respectively. (4-hydroxyphenyl)acetate and p-cresol are products from fermentation of tyrosine, and phenylacetate, 3-phenyllactate and 3-phenylpropanoate are products from fermentation of phenylalanine. All metabolomic data are provided in Supplementary Table S5.

