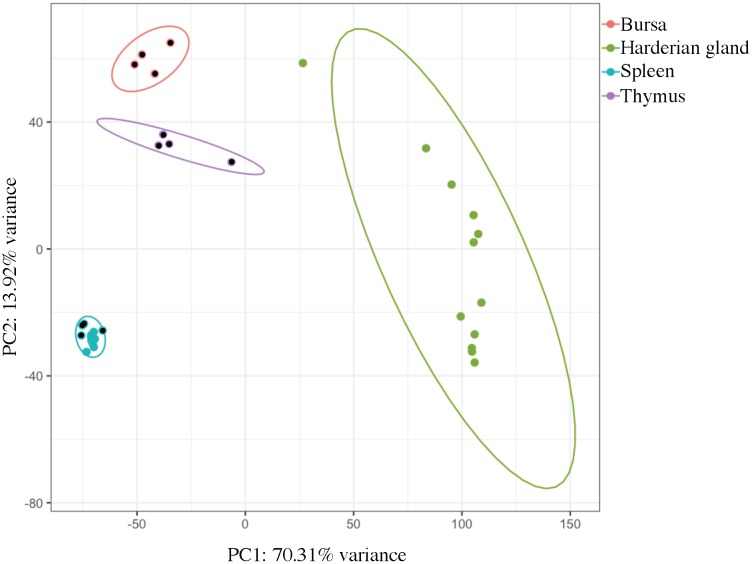
FIGURE 1.
Principal component analysis shows clear clustering by tissue type. Each dot represents a tissue from an individual chicken. Principal component 1 (PC1) separated the Harderian gland samples (green) from the other immune tissues. Principal component 2 (PC2) separated the Bursa (pink), Thymus (purple), and Spleen (blue). Ellipses were drawn with a 95% confidence. Dots with a black center were from Experiment 2. This plot was generated using pcaExplorer.

