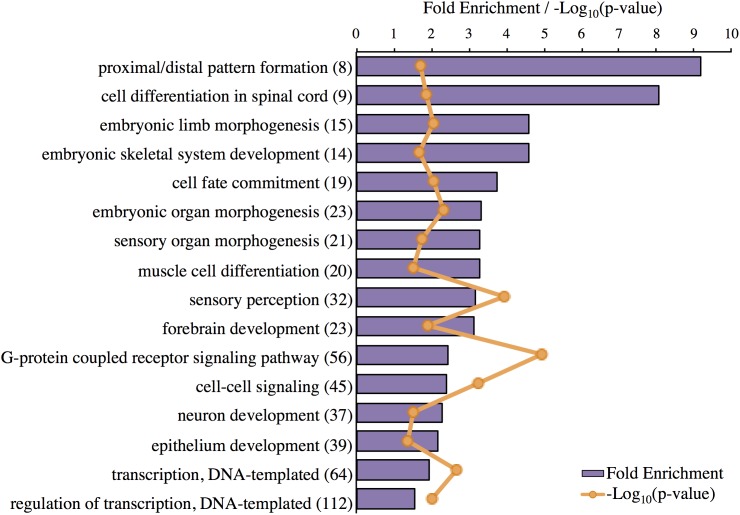
FIGURE 3.
Significant GO terms associated with genes highly expressed in the Harderian gland. Transcripts highly expressed in the Harderian gland were converted to their corresponding gene ID using Ensembl (766 total) and input into Panther for statistical overrepresentation analysis using GO biological process (757 genes recognized and used for the analysis). The fold enrichment (purple bar) was calculated as the number of observed input genes divided by the number of expected genes based on the number of genes in the chicken genome. The number of genes associated with each GO term is listed to the right of the GO term in parenthesis. The Bonferroni correction for multiple testing was used to adjust p-values. The -Log10(p-value) for each GO term is represented by orange markers.

