FIGURE 2.

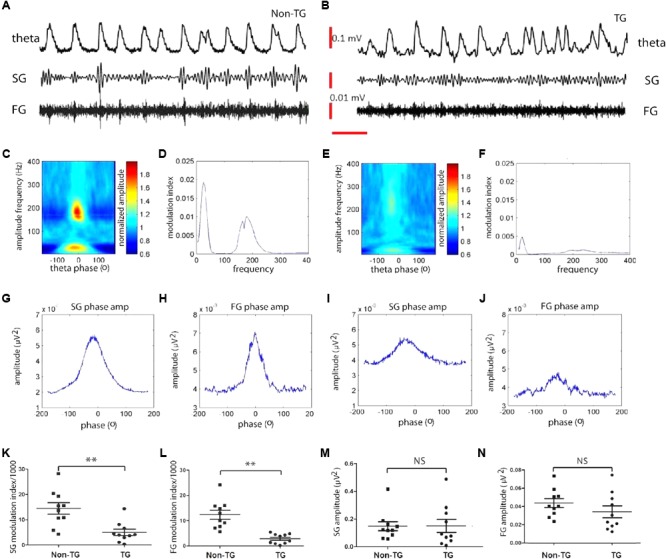
Theta-gamma cross frequency coupling (CFC) is affected as early as 1-month in J20 model. Representative trace filtered at theta (2–12Hz), slow gamma (25–55Hz), and fast gamma (150–250Hz) frequency band recorded from non-transgenic (Non-TG) and transgenic (TG) group (A,B). CFC between theta phase and gamma amplitude (C,E). Red plot indicates strong coupling to theta phase (C,E). Right plot, the modulation index (MI) value was measured to reflect how well the gamma amplitude is phase locked to the on-going theta cycles (D,F). Gamma amplitude modulation by theta phase in Non-TG and TG, respectively, slow gamma (G,I) and high gamma (H,J). The MI value of slow gamma and fast gamma are significantly lower in TG group than those from Non-TG group, as shown in K and L. The reduction of MI value was not due to gamma power change as shown in M and N. The TG and Non-TG group have similar slow gamma and fast gamma power (M,N). (n = 10 in each group, t-test, ∗∗: p < 0.01, NS: p > 0.05.
