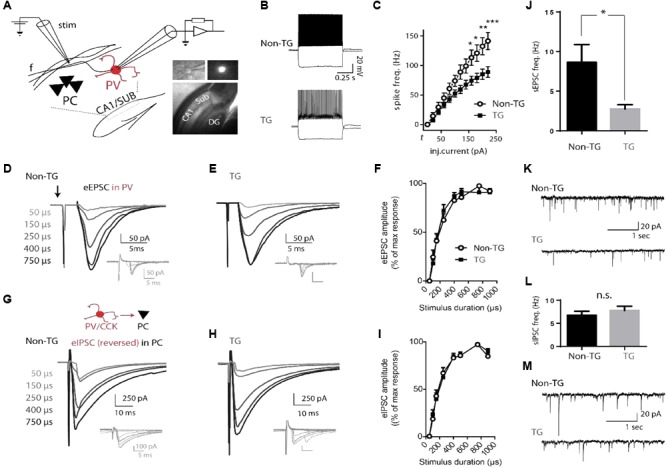
FIGURE 3.

Altered physiological properties of hippocampal PV interneurons in J20 mice. (A) Schematic drawing of the CA1/SUB region of a hippocampal slice showing the location of a recorded PV cell relative to a stimulation (Stim) electrode. Insert: representative images of a hippocampal slice and YFP-expressing fluorescent PV cell recorded in patch (40X). PC, pyramidal cell layer; f, CA1-subiculum fibers; DG, dentate gyrus. (B) Fast-spiking (FS) firing-pattern evoked in PV neurons from Non-TG and TG J20-PV-Cre animals (top and bottom, respectively) in response to depolarizing current steps. Hyperpolarizing steps essentially show absence of voltage-dependent inward rectification (depolarizing sag) and associated rebound firing. (C) Plot of mean firing frequencies in response to injected currents of various supra-threshold amplitudes in PV interneurons from Non-TG (open circles) and TG mice (solid squares). Current injections were 600 ms square pulses. Firing-frequencies are plotted from threshold current (t) to t + 200 pA. Note that PV cells from both groups show typical fast-spiking (FS) properties but that a significant group-specific difference in firing frequency is evident at current injection levels shown. (D,E) Representative examples of CA1 evoked excitatory post-synaptic currents (eEPSCs) recorded in PV cells from non-TG and TG mice. Each trace (average of 5–10 trials) was evoked by increasing the duration of the minimal current pulse, from threshold to maximum (50–900 μs), without changing the stimulus amplitude. Insets (gray traces below) show successive responses to minimal stimulation (with 5/10 failures in D and 4/10 failures in E). Extracellular electrical stimuli were delivered at low-frequency (0.33 Hz) through a glass pipette placed 100–200 μm from the soma of the recorded PV cell (in the stratum pyramidale/oriens, toward the CA1/sub border). Stimulus artifact is indicated by the arrow pointing down. Evoked EPSCs increased monotonically with stimulus duration until saturation at ∼400 μs. (F) Plot of mean eEPSC amplitude in response to stimuli of increasing duration for PV cells from Non-TG versus TG groups. The EPSC evoked at each stimulus duration was normalized to the maximal response of each neuron. Overall a two-way ANOVA indicated that the amplitude of CA1-projection evoked excitatory post-synaptic currents (eEPSCs) did not differ between Non-TG and TG mice. G and H, evoked inhibitory post-synaptic currents (eIPSCs) recorded in pyramidal neurons (average of 10 trials per trace) during activation of local inhibitory cells at various stimulation intensities in non-TG and TG mice. Insets (gray traces) show responses to minimal stimulation (4/10 failures in G; 6/10 failures in H). (I) Mean normalized amplitude of eIPSCs elicited in pyramidal neurons by electrical stimuli in local GABAergic cells. (J,K) mean frequency of spontaneous EPSCs (bar graph) recorded from PV cells in non-TG and TG mice and representative example. (L,M) same as J and K for spontaneous IPSCs recorded from PCs in non-TG and TG mice (n = 10, non-TG and 8, TG).
