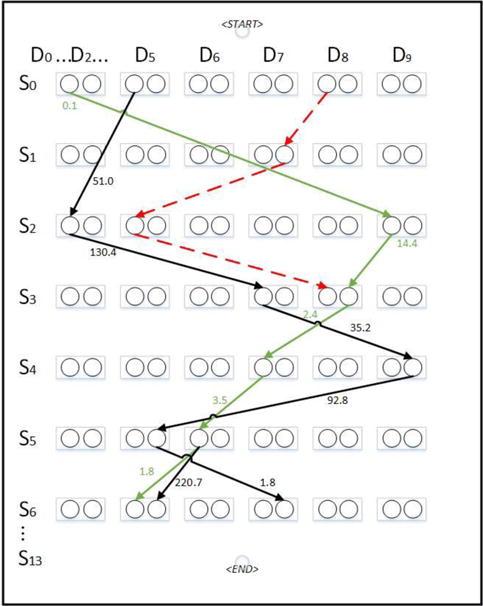
Fig. 1.

An illustration of the weighted graph of protein 1BJ7 (PDB ID). Selected rows and columns of the graph are shown. Although each node often has multiple outgoing edges, only a few are shown for clarity of viewing. Edges on the optimal path are shown in green. Edges in an invalid path is shown in red dashed line.
