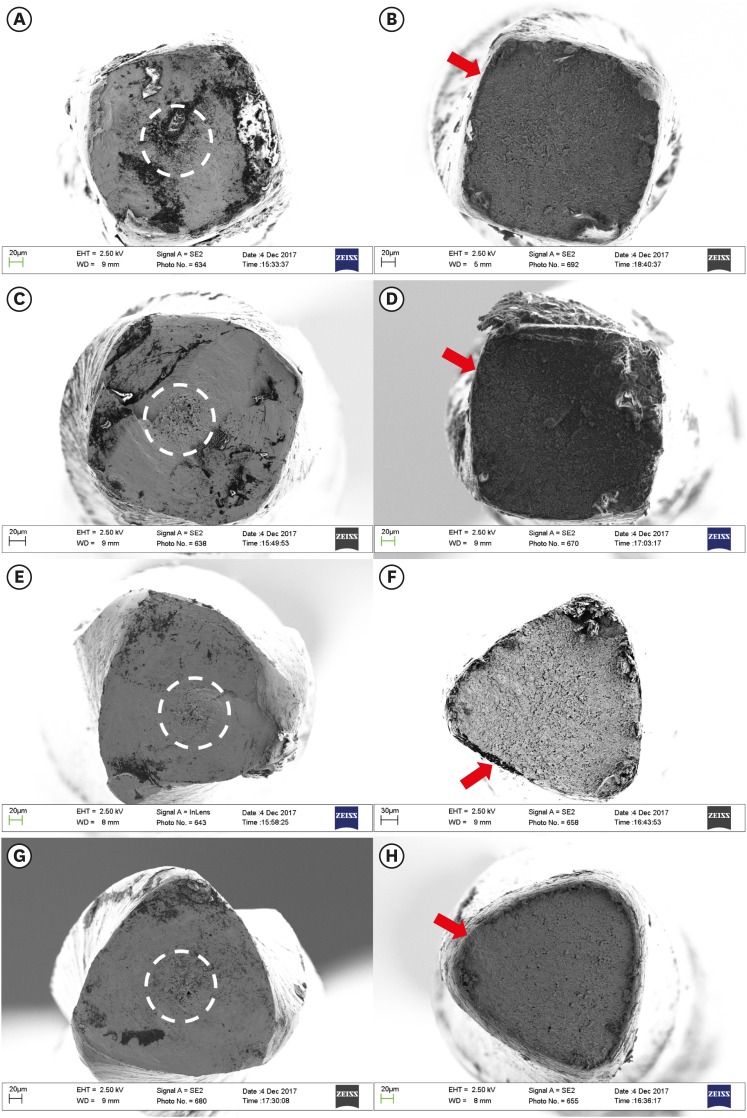
Figure 1.
Scanning electron micrographs of the fracture surface of the separated fragments. (A, B) M3 Rotary size 20/0.04; (C, D) M3 Pro Gold size 20/0.04; (E, F) M3 Rotary size 25/0.04; (G, H) M3 Pro Gold size 25/0.04. (A, C, E, G) The left column shows the images after the torsional test, with the circular box indicating the concentric abrasion mark; the skewed dimples near the center of rotation are typical features of torsional failure. (B, D, F, H) The right column shows images after the cyclic fatigue test, with red arrows indicating the crack initiation origin; the surface pattern shows dimples and cones observed in the same fracture plane.

