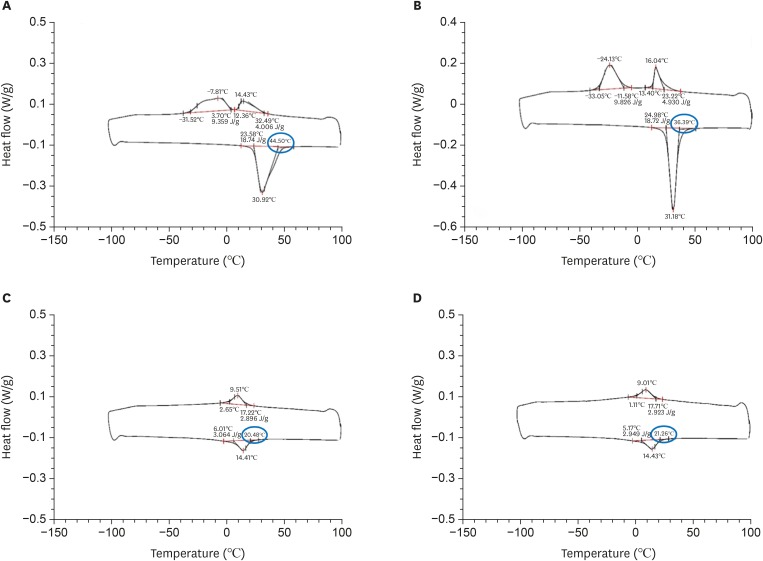
Figure 2.
Typical differential scanning calorimetry (DSC) diagram obtained from (A) an M3 Pro Gold size 20/0.04 file, (B) an M3 Pro Gold size 25/0.04 file, (C) an M3 Rotary size 20/0.04 file, and (D) an M3 Rotary size 25/0.04 file. Blue circles indicate the austenite transformation finishing point (Af) temperatures for each file.

