
Figure 1.
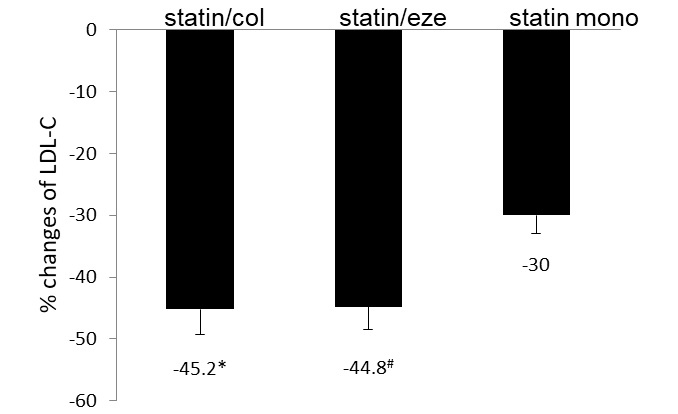
Percentage changes of LDL-C from baseline in the three groups after eight weeks of treatment. Patients in the statin/col and statin/eze groups achieved higher percentages of LDL-C reductions compared with those in the statin monotherapy group. Values are expressed as the ± standard error of the mean (n=60). *P=0.03 and #P=0.04 vs. the statin mono group. LDL-C, low-density lipoprotein cholesterol; col, colesevelam; eze, ezetimibe; mono, monotherapy.