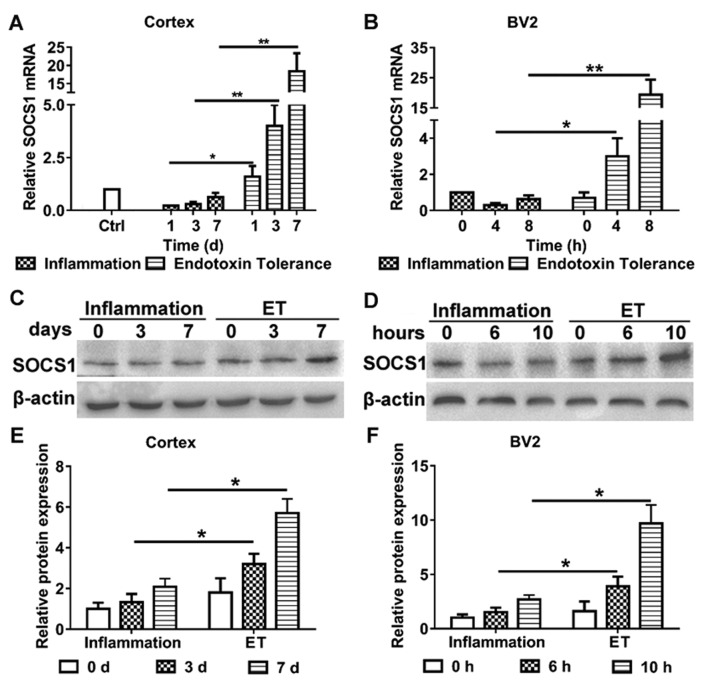
Figure 2.
(A-F) Expression of SOCS1 in the mouse cortex and BV2 cells. To induce inflammation and ET, BV2 cells were treated with a single injection of 100 ng/ml LPS, or 10 or 100 ng/ml LPS, respectively. SOCS1 (A) mRNA and (C) protein expression were detected in the cortex. SOCS1 (B) mRNA and (D) protein expression were detected in BV2 cells. (E and F) Densitometric evaluation of SOCS1 band intensities using Image J. Each experiment was repeated at least three times. The results are presented as the mean ± standard error of the mean. *P<0.05 and **P<0.01. ET, endotoxin tolerance; SOCS1, suppressor of cytokine signaling 1; LPS, lipopolysaccharide.

