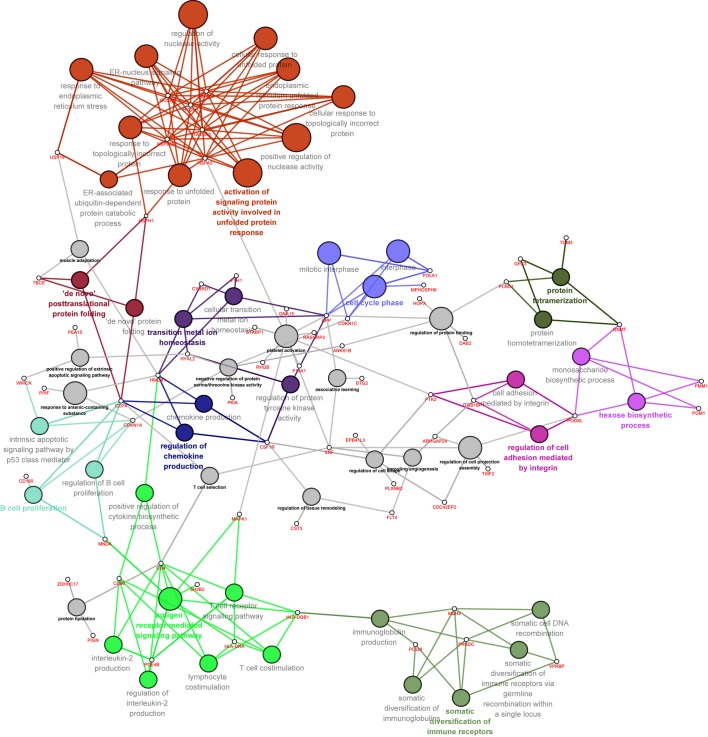
Figure 3.
BP categories of Gene Ontology and genes in the biological network. The size of BP nodes represents the significance of gene enrichment; bigger nodes indicate a smaller P-value. Different colored nodes represent the different functional classes of genes. The node names with the corresponding color represent the names of the functional classes in each color class. The small white circles represent gene nodes. All gene nodes in the network were the same size. Edges between BP nodes and gene nodes represent their ownership. Highlighted terms represent the most significantly enriched annotations. BP, biological process.

