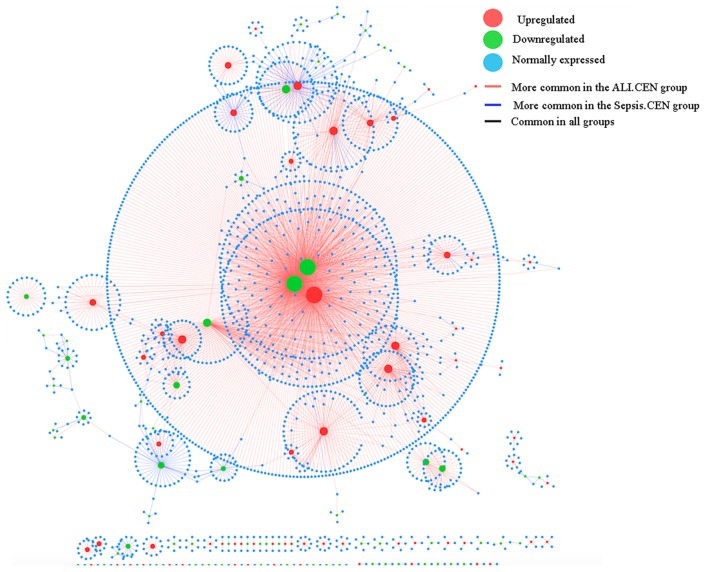
Figure 5.
Differential CEN between the ALI and sepsis groups. The red nodes represent upregulated genes; green nodes represent downregulated genes; the blue nodes represent normally expressed genes in samples taken from patients with ALI. The red edges were more common in the ALI.CEN group; the blue edges were more common in the Sepsis.CEN. Black edges are common in all of them. The size of the nodes indicates the degree of them. The bigger the size of the nodes is, the higher the degree is. CEN, co-expression networks; ALI, acute lung injury.

