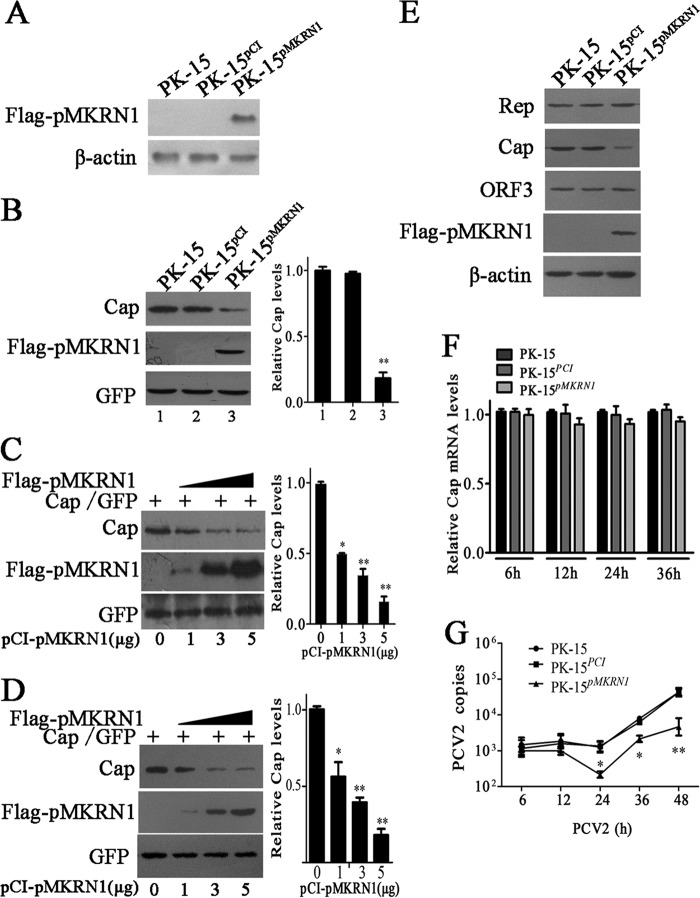
FIG 3.
Overexpression of pMKRN1 decreases ORF2 protein levels and inhibits the replication of PCV2. (A) A stable cell line, PK-15pMKRN1, expresses the pMKRN1 protein. PK-15 cells were transfected with linearized pCI-Flag-pMKRN1 or the control vector, pCI-neo, to establish PK-15pMKRN1 and PK-15PCI cells selected by G418, respectively. The cells were analyzed by immunoblotting using an anti-Flag antibody. β-Actin was detected as an internal control. (B) The level of Cap was decreased in cells overexpressing pMKRN1. (Left) The pcDNA-Cap and pEGFP vectors were cotransfected into PK-15, PK-15PCI, or PK-15pMKRN1 cells, and Cap, pMKRN1, and GFP levels were detected by immunoblotting. (Right) The ImageJ program was used to quantify the relative intensities of the bands. **, P < 0.01 versus the Cap level of PK-15 cells. (C and D) Increased pMKRN1 expression is correlated with decreased Cap. (Left) Different doses of pCI-Flag-pMKRN1 plasmids (0, 1, 3, 5 μg) were transfected with a fixed amount of Cap expression vectors into PK-15 cells (C) or ST cells (D), and Western blotting was used to examine Cap expression. GFP was used as a control. (Right) Relative intensities of the bands. *, P < 0.05 versus Cap levels in PK-15 cells or ST cells with 0 μg of pCI-Flag-pMKRN1 transfection; **, P < 0.01 versus Cap levels in PK-15 cells or ST cells with 0 μg of pCI-Flag-pMKRN1 transfection. (E to G) PK-15, PK-15PCI, and PK-15pMKRN1 cells were infected with PCV2 at an MOI of 1 for the indicated periods, and PCV2 Rep, Cap, and ORF3 protein levels were determined by Western blotting (E); the mRNA levels of Cap (F) and PCV2 copy numbers (G) were determined by quantitative PCR. The Cap mRNA levels of PK-15 cells at each time point were defined as 1 in panel F. The data shown are representatives from three independent experiments. *, P < 0.05 versus PCV2-infected PK-15 cells at the same time points; **, P < 0.01 versus PCV2-infected PK-15 cells at the same time points.

