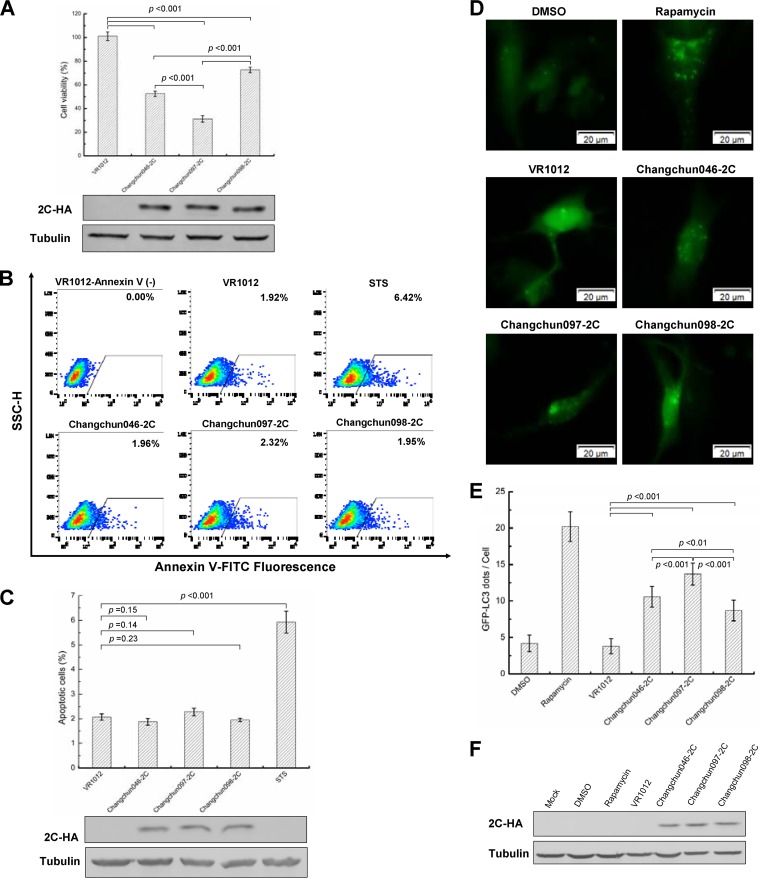
FIG 9.
CV-A6 2C protein induces cell death through autophagy instead of apoptosis in RD cells. (A) Cell lethality caused by different CV-A6 2C proteins in RD cells. Changchun046 2C-, Changchun097 2C-, or Changchun098 2C- expressing vectors were transfected into RD cells, and a cell proliferation assay was performed at 48 h posttransfection. Western blotting results indicating expression levels of viral 2C proteins for the cell lethality experiment are shown. (B) Representative flow charts for the apoptosis analysis. Changchun046 2C-, Changchun097 2C-, or Changchun098 2C-expressing vectors were transfected into RD cells. The RD cells were harvested at 48 h posttransfection, and cell death was evaluated by flow cytometry. The percentages of apoptotic cells corresponding to the increased FITC fluorescence intensity for each of the experimental conditions are indicated. RD cells transfected with VR1012 or treated with STS were used as negative and positive controls, respectively. (C) Bar graph of apoptosis analysis in RD cells. Shown are Western blotting results indicating the expression levels of viral 2C proteins from panel B. (D) Live-cell imaging showing GFP-LC3 aggregation. RD cells were cotransfected with pEGFP-LC3 and the VR1012 empty vector, Changchun046 2C, Changchun097 2C, or Changchun099 2C. Rapamycin was used as a positive control to induce autophagy. The GFP-LC3 aggregations in the cells were observed by fluorescence microscopy at 48 h posttransfection. Representative images are shown. Magnification, ×400. (E) Bar graph indicating average GFP-LC3 dot formation in RD cells expressing CV-A6 2C. Each bar value indicates the average number of GFP dots in 10 cells per sample. Rapamycin was used as a positive control. (F) Western blotting results showing 2C protein expression in RD cells from panel E. The values in panels A, C, and E are shown as means ± SD.

