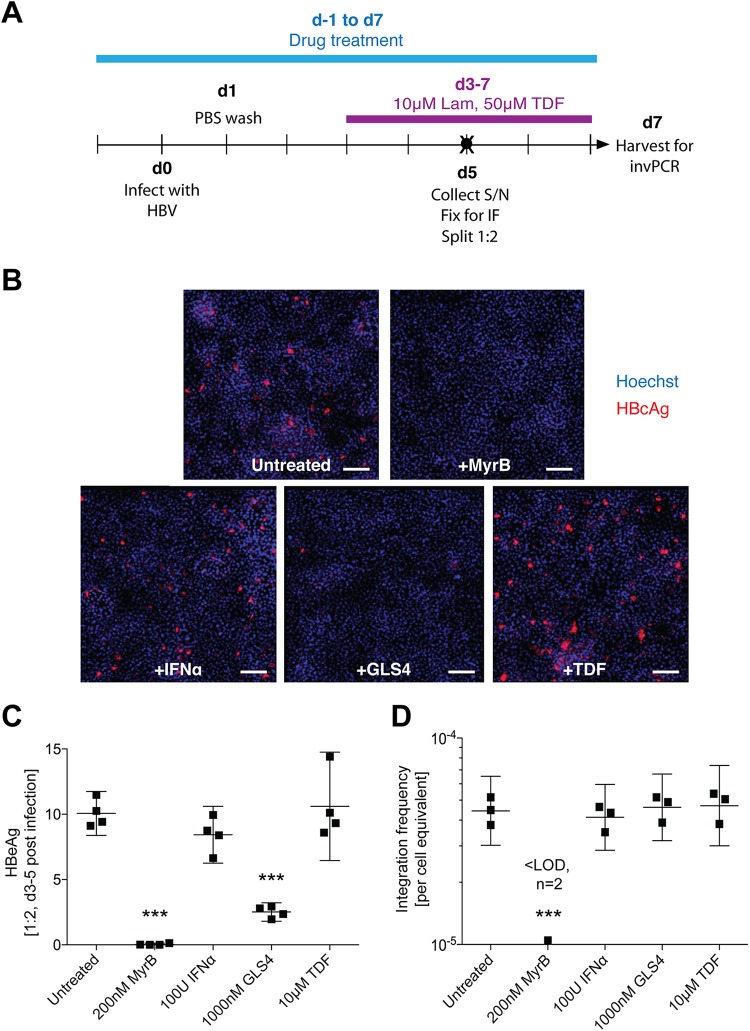
FIG 6.
Effect of anti-HBV compounds on HBV DNA integration frequency. Huh7-NTCP cells were infected as per the d7 time course in Fig. 5A (A) after 1 day of preincubation with various anti-HBV drugs (blue bar), including MyrB, interferon alpha (IFN-α), GLS4, and tenofovir. At 5 dpi, one set of replicates was analyzed by immunofluorescence (B). HBcAg staining is shown in red, and Hoechst nuclear staining is shown in blue. The scale bar represents 250 μm. Cell supernatant was also collected at 5 dpi (black circle in panel A) and analyzed by immunoassay for secreted HBeAg (C; mean ± 95% CI; ***, P < 0.001, compared to untreated control by one-way analysis of variance [ANOVA]; n = 4). At 7 dpi, total DNA was extracted from cells and analyzed by invPCR for HBV DNA integration (D; geometric mean ± 95% CI; ***, P < 0.001 by one-way ANOVA; n = 3).

